From: AAAI Technical Report SS-94-01. Compilation copyright © 1994, AAAI (www.aaai.org). All rights reserved.
Breast Cancer Diagnosis and Prognosis via Linear Programming
O. L. Mangasarian
Computer Sciences Department
1210 West Dayton Street
University of Wisconsin
Madison, WI 53706.
Email: olvi@cs.wisc.edu
W. Nick Street
Computer Sciences Department
1210 West Dayton Street
University of Wisconsin
Madison, WI 53706.
Emaih street@cs.wisc.edu
William H. Wolberg
Department of Surgery
University of WisconsinClinical Sciences Center
600 Highland Avenue
Madison, WI 53792
January 25, 1994
1
Introduction
This ongoing multi-disciplinary
research directly addresses problems arising in the diagnosis and treatment
of breast cancer. Early detection of breast cancer is enhanced and unnecessary surgery avoided by diagnosing
breast masses from Fine Needle Aspirates (FNA’s).
using and extending results from the fields of optimization, machinelearning, statistics and image processing, a
software system was created that allows highly accurate
diagnosis of breast FNA’s even by untrained users. The
system is in current use at the University of Wisconsin
Hospitals. For malignant cases, treatment decisions are
enhanced by accurately predicting the long term behavior
of the disease. This paper summarizes our recent work in
both areas of diagnosis and prognosis, with emphasis on
the more difficult latter problem.
2
Image
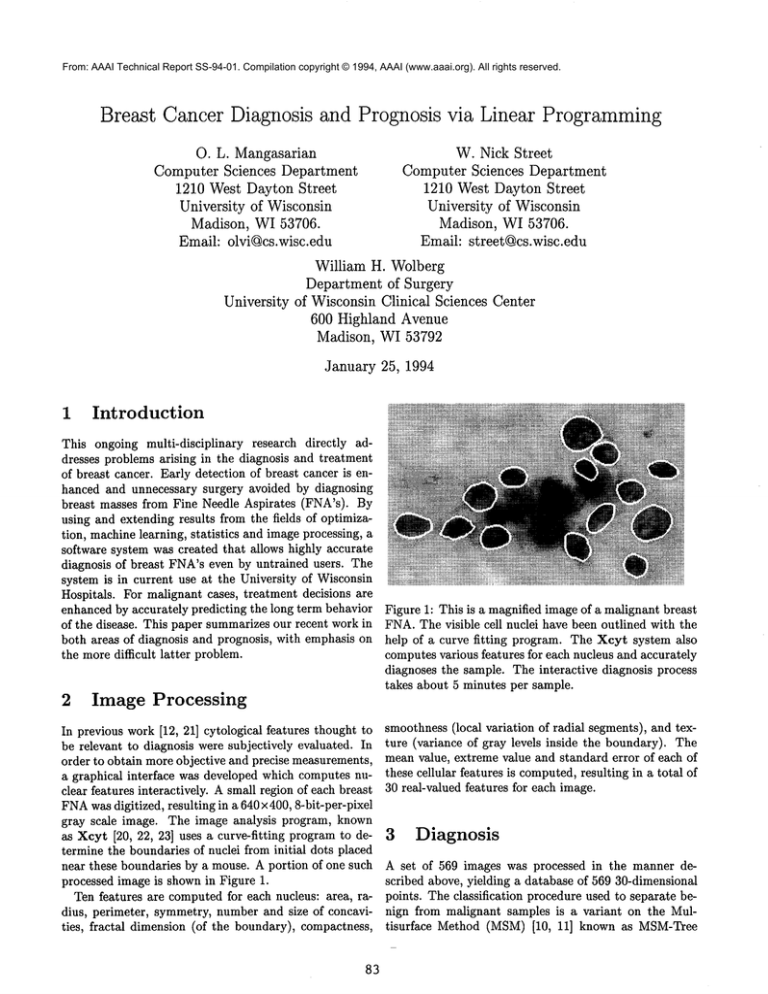
Figure 1: This is a magnified image of a malignant breast
FNA.The visible cell nuclei have been outlined with the
help of a curve fitting program. The Xcyt system also
computes various features for each nucleus and accurately
diagnoses the sample. The interactive diagnosis process
takes about 5 minutes per sample.
Processing
In previous work [12, 21] cytological features thought to
be relevant to diagnosis were subjectively evaluated. In
order to obtain more objective and precise measurements,
a graphical interface was developed which computes nuclear features interactively. A small region of each breast
FNAwas digitized, resulting in a 640 × 400, 8-bit-per-pixel
gray scale image. The image analysis program, known
as Xcyt [20, 22, 23] uses a curve-fitting program to determine the boundaries of nuclei from initial dots placed
near these boundaries by a mouse. A portion of one such
processed image is shown in Figure 1.
Ten features are computed for each nucleus: area, radius, perimeter, symmetry, number and size of concavities, fractal dimension (of the boundary), compactness,
smoothness (local variation of radial segments), and texture (variance of gray levels inside the boundary). The
mean value, extreme value and standard error of each of
these cellular features is computed,resulting in a total of
30 real-valued features for each image.
3
Diagnosis
A set of 569 images was processed in the manner described above, yielding a database of 569 30-dimensional
points. The classification procedure used to separate benign from malignant samples is a variant on the Multisurface
Method (MSM) [10, 11] known as MSM-Tree
(MSM-T) [1, 2]. This method uses a linear programming [6] model to iteratively place a series of separating
planes in the feature space of the examples. If the two
sets of points are linearly separable, the first plane will
be placed between them. If the sets are not linearly separable, MSM-Twill construct a plane which minimizes
the average distance of misclassified points to the plane,
thus nearly minimizing the numberof misclassified points.
The procedure is recursively repeated on the two newly
created regions. The resulting planes can then be used
in the manner of a decision tree to classify new points.
MSM-Thas been shown [1] to learn concepts as well or
better than more traditional
learning methods such as
C4.5 [14, 15] and CART[4].
Even a simple single-plane classifier can be considered
as ’overtraining’ in a high-dimensional space. In our case,
better generalization was achieved by reducing the number of input features considered. The best results were obtained with one plane and three features: Extreme area,
extreme smoothness and mean texture. Applied to all the
data, the training separation was 97.3%; the predicted
accuracy, estimated with cross-validation[19], was 97.0%.
This classifier was built into the Xcyt system and has
achieved 100% chronological correctness on the 72 new
cases diagnosed. Xcyt also uses density estimation techniques [13] to estimate the probability of malignancy for
new patients.
TTR. The motivation for the RSAapproach is that:
* Recurrences actually took place at somepoint in time
previous to their detection. However, the difference
between the time a recurrence is detectable (actual
TTR) and the time it is actually detected (observed
TTR) is probably small.
¯ Observed DFS time is a lower bound on the recurrence time of that patient.
The linear programto be solved for a given training set
is as follows:
leTy
--v
(1)
subject to
1 T
-~ez +~’~-eTvm
< Mw + Te - t
-Nw-~/e+r
v
Y
z
+
<_
<
>
>
>
y
z
0
0
0
The purpose of this linear program is to learn the
weight vector w and the constant term 7. These parameters determine a recurrence surface s = wx+7, where x is
the vector of measured features and s is the surface which
fits the observed recurrence times. Here Mis an m × n
matrix of the m recurrent points, with recurrence times t.
Similarly, the k non-recurrent points are collected in the
matrix k x n matrix N, and their last knowndisease free
4 Prognosis:
Recurrence Surface survival times in r. The vectors y and z represent the errors for recurrent and non-recurrent points, respectively;
Approximation
overestimating the TTRof recurrences is considered an
error, while predicting a TTRwhich is shorter than an
A more difficult question concerns the long-term progno- observed DFSis also an error. The objective averages the
sis of patients with cancer. Several researchers, beginning errors over their respective classes. The v term, weighed
with Black et al [3], have shown evidence that cellular
by an appropriately small 5, forces underestimated recurfeatures observed at the time of diagnosis can be used rent points closer to the surface. (Note: e is a vector of
to predict whether or not the disease will recur following l’s of appropriate dimension.)
surgery. This problem does not fit into the usual classifiAs in classification, it is important to choose the right
cation paradigm; while a patient can be classified ’recur’ subset of features to get the best generalization.
We
if the disease is observed, there is no real cutoff point at choose an appropriate feature set in the following autowhich she can be considered a ’non-recur’. The data are matic fashion. A tuning set - one tenth of the training
therefore censored [9], in that we know a Time to Re- cases - is first set aside. The RSAlinear program is then
cur (TTR) for only a subset of patients; for the others,
solved using all of the input features, and the resulting
we know only the time of their last check-up, or Disease surface is tested on the tuning set. Features are then
Free Survival time (DFS). Traditional approaches such
removed, one by one, by setting the smallest (in magnias Cox regression [5] group large numbers of patients to- tude) element of the coefficient vector w to zero. z Each
gether in order to predict overall survival trends. We new problem is solved and the result tested on the tuning
approach the prediction of TTRas a function estimation set, until only one feature remains. 2 Using the features
problem, a mapping of an n-dimensional real input to a
1All feature values werepreviouslyscaled to be zero meanand
one-dimensional real output. Here, the input consists of
unit
standarddeviation, so that the magnitude
of the weightvector
the thirty nuclear features computed by Xcyt together
component
correlates roughlywith the relative importanceof the
with with two traditional prognostic predictors: tumor corresponding
feature.
size and number of involved lymph nodes.
2Thesesubsequentlinear programsare easily formulatedby placOur solution to this estimation problem is known as ing explicit upperand lowerboundsof zero on the appropriateelementsof w. A ’hot start’ can then be used to solve the newLP
the Recurrence Surface Approximation (RSA) technique.
starting fromthe solution to the previousone. Thesesolutions are
RSAuses linear programming to determine a linear com- foundvery quickly, often in one or two orders of magnitudefewer
bination of the input features which accurately predicts simplexiterations than the original problem.
84
which showed the best performance on the tuning set, we
then re-optimize using all the training data (e.g., restore
the tuning set). In this manner, we can use the tuning
set to select the complexity of the model without paying [~ ~
~
the penalty of losing some of the training set.
The RSA procedure was fit into a cross-validation
framework to evaluate its accuracy in predicting future
outcomes. As is typical in the machine learning community, the cross-validation procedure is used only for estimation of performance, not for parameter choosing. Of
the 569 patients from the diagnosis study, the 175 malignant cases with follow-up data (35 of which have recurred)
were used.
Figure 2 shows the mean generalization errors of the ~
original RSAcompared against the following prediction
methods:
36.7
32.6
23.5
AUPoints
RecursOnly
26~
16-g
~
RSA:Original
[----’]
RSA:Po~ledError
~
Least1.normErroron Recurs
m
ModifiedBack-propagation
¯ Pooled RSA" This method is identical to RSAexNon-recurs
Only
cept that all the points are weighted equally in the
objective function, rather than the recurrent and Figure 2: Comparative results on all points, recurrent
non-recurrent cases being averaged separately. The cases only and non-recurrent cases only are shown for
resulting objective function is
various prediction methods. Overall results are very encouraging, with the simple linear model produced by RSA
1
comparing favorably with the highly non-linear Artificial
(2) mq_l~eTy--bm--~eTz--km--~eTv
Neural Network predictions.
Note that the RSAresults
are strongly affected by varying relative importance of
¯ Least 1-norm Error on Recurs:
An obvious
recurrent and non-recurrent points.
method for predicting recurrence is to minimize the
average error on just the recurrent cases.
¯ Modified Back-propagation:
We also evaluated
an Artificial Neural Network (ANN)using a modified
version of back-propagation [17]. The output unit for
our ANNused the identity function as its response
rather than the familiar sigmoid, allowing any realvalued output. The error function was also changed
to the one-sided errors as used in the RSA; learning took place only on underestimated non-recurrent
cases and overestimated recurrent cases. A tuning
set was used to avoid possible overtraining.
which is easy to use and at least as accurate as diagnosis done at specialized cancer centers (see for example the collection of studies by Frable [8]). The ongoing
prognostic prediction research is less easily evaluated but
will hopefully reach the same goal. Using only information available at the time of diagnosis and surgery, we are
able to generate reasonably accurate predictions specific
to individual patient. Related work on prognosis using
machine learning has appeared in [16, 18].
One limitation of the described approaches is the inherent linearity of the predictive models. In order to add
more predictive power to the RSA method, we are imand Future Work plementing extensions similar to Wolpert’s Stacked Gen5 Conclusions
eralization [24] and Fahlman’s Cascade Correlation [7].
Powerful machine learning paradigms such as backpropa- These models will introduce non-linearity to the predicgation are widely available in commercial systems. How- tion process by training different subsets of the input data
ever, for various reasons, integration of such systems into separately, and combiningthe resulting predictions.
clinical practice has been slow and uncertain. By building
upon the traditional optimization technique of linear programming, we are creating techniques which train faster
and yield more interpretable results, while demonstrating comparable accuracy. Wehope that these systems 6
Acknowledgements
will gain wider acceptance in the field of breast cancer
diagnosis and treatment.
To accomplish this, the resulting systems must give the This research was supported by Air Force Office of Sciphysician information that directly affects patient care. entific Research Grant F-49620-94-1-0036 and National
This has been accomplished with our diagnostic system, Science Foundation Grant CCR-9101801.
85
References
[14]J.
[1] K. P. Bennett. Decision tree construction via linear
programming. In M. Evans, editor, Proceedings of
the ~th MidwestArtificial Intelligence and Cognitive
Science Society Conference, pages 97-101, 1992.
R. Quinlan. Decision trees as probabilistic classifiers. In Proceedings of Fourth International Workshop on Machine Learning, Los Altos, CA, 1987.
Morgan Kaufmann Publishers, Inc.
[15]J.
R. Quinlan. Simplifying decision trees. International Journal of Man-MachineStudies, 27, 1987.
[2] K. P. Bennett and O. L. Mangasarian. Robust linear programmingdiscrimination of two linearly inseparable sets. Optimization Methods and Software,
1:23-34, 1992.
[16]P.
[3] M. M. Black, S. R. Opler, and F. D. Speer. Survival
in breast cancer cases in relation to the structure of
the primary tumor and regional lymph nodes. Surg
Gynecol Obstet, 100:543-551, 1955.
[17]D.
M. Ravdin and G. M. Clark. A practical application of neural network analysis for predicting outcome of individual breast cancer patients. Breast
Cancer Research and Treatment, 22:285-293, 1992.
[4] L. Breiman, J. Friedman, R. Olshen, and C. Stone.
Classification
and Regression Trees. Wadsworth,
Inc., Pacific Grove, CA, 1984.
Jour[5] D. R. Cox. Regression models and life-tables.
nal of the Royal Statistical Society, B 34:187-202,
1972.
[6] G. B. Dantzig. Linear Programmingand Extensions.
Princeton University Press, Princeton N J, 1963.
E. Rumelhart, G. E. Hinton, and R. J. Williams.
Learning internal representations by error propagation. In D. E. Rumelhart and J. L. McClelland, editors, Parallel Distributed Processing, volume1, chapter 8. MIT Press, Cambridge, Massachusetts, 1986.
[18]A.
Schenone, L. Andreucci, V. Sanguinetti,
and
P. Morasso. Neural networks for prognosis in breast
cancer. Physica Medica, IX(Supplement 1):175-178,
June 1993.
[19]M. Stone.
Cross-validatory choice and assessment of
statistical predictions. Journal of the Royal Statistical Society, 36:111-147, 1974.
[20]W. N.
[7] S. E. Fahlman and C. Lebiere.
The cascadecorrelation learning architecture.
In Advances in
Neural Information Processing Systems 2, pages
524-532, San Mateo, California, 1990. Morgan Kaufmann Publishers, Inc.
[8] W. J. Frable. Thin-needle aspiration biopsy. In Major Problems in Pathology 14. WBSaunders Co.,
Philadelphia, 1983.
[9] E. T. Lee. Statistical
Methods for Survival Data
Analysis. John Wiley and Sons, NewYork, NY, 1992.
[10] O. L. Mangasarian. Multi-surface method of pattern
separation. IEEE Trans on Information Theory, IT14:801-807, 1968.
Street, W. H. Wolberg, and O. L. Mangasarian. Nuclear feature extraction for breast tumor diagnosis. In IS~T/SPIE 1993 International Symposium
on Electronic Imaging: Science and Technology, volume1905, pages 861-870, San Jose, California, 1993.
[21]W. H.
Wolberg and O. L. Mangasarian. Multisurface
method of pattern separation for medical diagnosis
applied to breast cytology. Proceedings of the National Academy of Sciences, U.S.A., 87:9193-9196,
1990.
[22]W. H.
Wolberg, W. N. Street, and O. L. Mangasarian. Machine learning techniques to diagnose breast
cancer from image-processed nuclear features of fine
needle aspirates. Cancer Letters, 1993. accepted.
[23]W. H.
Wolberg, W. N. Street, and O. L. Mangasarian. Breast cytology diagnosis via digital image analysis. Analytical and Quantitative Cytology and Histology, in press.
[11] O. L. Mangasarian. Mathematical programming in
ORSA Journal on Computing,
neural networks.
5:349-360, 1993.
[24]D.
[12] O. L. Mangasarian, R. Setiono, and W. H. Wolberg.
Pattern recognition via linear programming: Theory
and application to medical diagnosis. In T. F. Coleman and Y. Li, editors, Proceedings of the Workshop
on Large-Scale Numerical Optimization, pages 2231, Philadelphia, Pennsylvania, 1990. SIAM.
[13] E. Parzen. On estimation of a probability density
and mode. Ann. Mathematical Statistics,
35:10651076,1962.
86
H. Wolpert. Stacked generalization.
works, 5:241-259, 1992.
Neural Net-

