Wn
advertisement
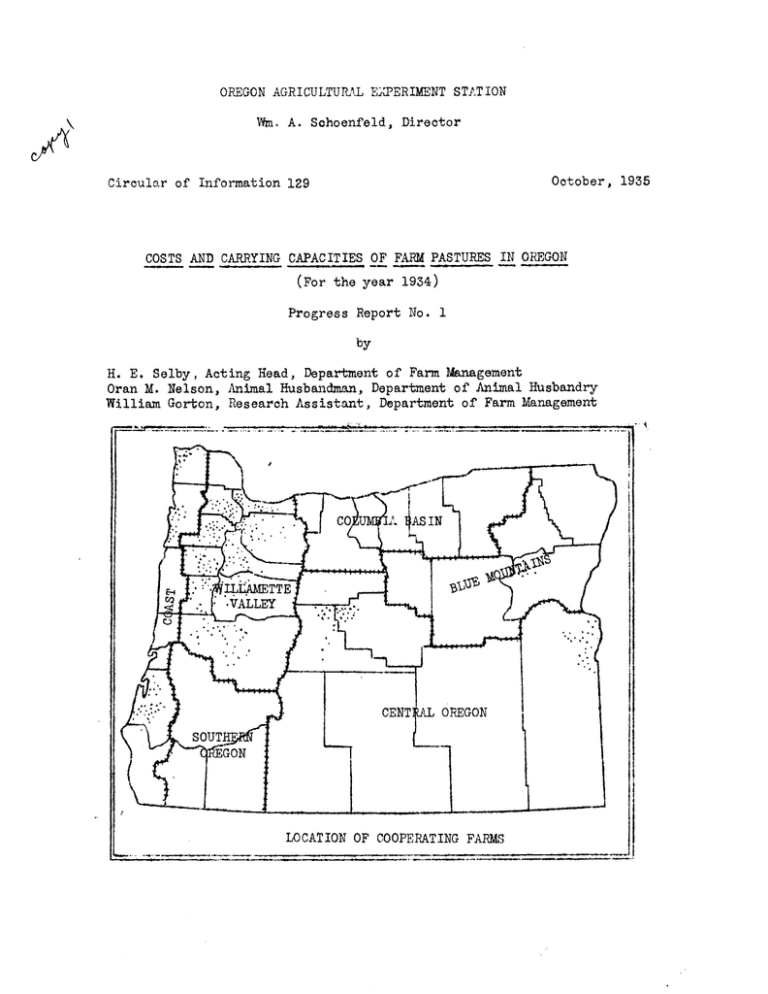
OREGON AGRI CULTURAL EXPERIMENT STAT ION Wn A. Sohoenfeld, Director October, 1935 Circular of Information 129 COSTS AND CARRYING CAPACITIES OF FARM PASTURES IN OREGON (For the year 1934) ?rogre8s Report No. 1 by H. E. Selby, Acting Head, Department of Farm Management Oran M. Ne1son Animal Husbandman, Department of Animal Husbandry William Gorton, Research Assistant, Department of Farm Management * * * * * * .* .* * * * * * * * * *. * * * * * * *. *. * * * * * * * * ACKNOWDGW1S * * * * * * * * * * * * * * * * * * * * * * The study reported on herein wis made possible only because of the excellent cooperation received The authors from the many individuals participating. wish to express their appreciation for assistance rendered by the farmers who cooperated in this study; by county agents A.fton Zunde2, C. H, Bergstrom, G. H. Jenkins, 0. S. Fletcher, F. C, Mullen, 'N. S. Averill, J, R, Beck, H, L, Riches, S. T. Imite, J, J, Inskeep, W, F. Cyrus, 5, B. Hall, G. Y, Hagglund, W. B. Tucker, F, T. Fortner, and R. G, Larson, who assisted in selecting representative study areas ar contacting farms; by E, J. Niederfrank and Howard Smith, graduate assistants in Farm Management; G, 'N. Kuhiman, Assoclate Economist, Department of Farm Management, and E. R. Jackman, Extension Agronomist, who assisted in securing field records; and by A, S. Burner, Assoc late Economist, Department of Farm Man.gement, who assisted in preparing the manuscript for this progress report. ** ****** ***** ******* * ***** * * * * * * * * * * * * ' * * * * * * * * * * * * * COSTS AJD CJRRYING CAPACITIES OF FARM PASTURES I' OREGON Grass for pasture purposes is from the acreage standpoint, by far the most important Thrm crop in Oregon. According to preliminary figures from the 1935 Census, 12,038,576 acres, or 6D percent of the land in farms, in Oregon are used Ibr pasture purposes. Yii0 the proportion of the farm araa used for grazing varies somewhat in the different agricultural regions of Oregon it is significant that in only one region, the Willamette Valley, is less than half of the land in farms so used, and in two regions over 80 percent of the land in farms is classed as pasture (Table 1). The importance of farm pastures is further emphasized by the preliminary figures for the 1935 Ccnus which show a total of 171,000 horses and mules, 929,000 cattle, and 2,210,000 sheep on farms January 1, 1935. Much of the feed a.pp1y of this vast herd of livestock must come from farm pastures. TABLE 1. PERCENT.WE OF TOTAL FRM ACREAGE IN PASTURE Agricultural region Lan in farms (aires) Peroenag ofTirm land nsure able Woodland 9% Plow- 61% 15 66 83 5 9 67 81 1,078,591 7 35 24 66 637,361 7 22 24 53 2_,957,154 1 31 12 44 l,357,549 4 16% 495 4,363,126 2% Blue Mountains 3,504,828 2 Central Oregon 4,816,489 Southern Oregon Willamette Valley STATE TOTAL Source of data: Tota' Pasture 5 Columbia Basin Coast Other Preliminary figures from 1935 Census. Owing to differences in soil, climnte and elevation, the typc and quality of both native ar tame pastures vary widely in the different s a result of these differences, there agricultural regions of Oregon. can be no uniform system of pasture management for the state as a whole. Each region has tended, by trial and error methods, to work out systems of grazing and pasture management applicable to the existing conditions in that particular region. There is considerable evidence that this procedure has not been conducive to the fullest utilization of the pasture resources of Oregon. It is believed that one of the first steps in working out bettor methods of farm pasture utilization is to measure as accurately as possible the economic position of these pastures. The report whih follows constitutes a brief preliminary summary of the first year's results of such a study. The data presented cover the calendar year of 1934 and were secured by the survey method directly from cooperating farmers. Objectives of the Stu4y The specific objectives of 'this study are: 1. To ascertain the carrying capacities of various types of tame and native farm pastures in the different agricultural regions of Oregon. 2. To determine the costs of establishing and maintaining these pastures. 3, To point out the major factors which affect the establishment and maintenance costs of these pastures. 4. To suggest methods by which the establishW.Oflt and maintenance costs of such pastures may be reduced. The cost figures and other data presented in this report are in nature and are not intended to fully cover all of the prelimina above objectives. All data presented are subject to revision when the final report on this project is issued. Scope Study In this report the three agricultural regions of Eastern Oregon have been considered as one unit, since so far only the irrigated pastures of these regions have been studied, and irrigated pasture conditions in these areas are very similar. Other regions studied during the first year of work were the Coast ar Wil].cmette Valley areas. The location, by counties and regions, of the farms cooperating in Information was obtained conthis study is shown on the cover page. cerning a total of 373 pastures located on 319 different farms. These pastures contained 15,964 acres of actual pasture exclusive of waste areas, and during 1934 provided 1,743,471 animal unit days* of grazing. Of those farms, 229 were located in the Willamette Valley, 68 in the Coast areas and 76 in the eastern Oregon irrigated areas, The heavy representation given the Willamette Valley was occasioned by the fact that it has such variable types of pasture, and by the agricultural importance of this area which contains 54 percent of the total farms in the state. In this study the term "animal unit day" refers to grazing for not loss than ten hours during a continuous twenty-four hour period of either .8 of a horse, 1 head cattle two years or older, 2 yearling cattle or calves, 5 mature sheep or goats, 5 lambs or kids after July 1, 8 hogs or 100 poultry. If grazing amounted to less than two hours it was ignored; if two hours or over, but less than eight hours, credit was given for one-half animal unit day; and if eight hours or over but less than ten hours, credit was given for three-fourths day of graEing. Frequently supplemental feeding was practiced, but this was ignored in computing a day of grazing. * 3. Kind of Stook Pastured The kinds of stock pastured on the 373 pastures covered by this in both the Willamette Valley and the study are indicated in Table 2. irrigated areas of Eastern Oregon, farm flocks of sheep constitutc a substantial percentage of the animal unit days of grazing, while in the coast area dairy cattle are the only important typo of stock grazed. Likewise cattle other than dairy stock arc of some importance in both Eastern Oregon and the Willamette Valley. In considering the data which in mind, for they have a direct bearfollow, these facts should be borr ing on pasture management, and on many of the other factors considered in this study. TABLE 2. DISTRIBUTION OF .NIM.L UNIT DAYS OF GRAZING BY KINDS OF LIVESTOCK Kind of stock roentage distribution of i Eastern 1illainetto Valley Oregon as Coast 43% 54% 87% Young dairy stock 9 6 7 Other cattle 7 15 Sheep 22 12 2 Lambs 10 4 - Goats 7 - 2 Hogs - - - Horses 2 7 Dairy cows TOTAL 100% 100% 100%, Cost of Maintaining Farm Pastures The itemized costs of maintaining farm pastures in the Coast, Willaxnette Valley, and representative Eastern Oregon irrigated areas are presented in Tables 3,4, and 5. These costs include not only the direct cash outlay, but also noncash or deferrable cost items suoh as the value of operator and family labor, depreciation of equipment and stand, and 5 percent interest on the farmer' a estimated value of the pasture land. Al]. costs presented are weighted averages of a composite The number of records and area of pasture averaged in each sample sam)le. is indicated at the head of each column. 4. In considering the costs per acre and per animal unit day it should be borne in mind that these costs may have little relation to the quality or value of' the grazing produced. An attempt has been made to measure the quality of the feed produced by the different types of pastures in terms of Total Digestible Nutrients (T.D.N.),* Cost per pound of T, D. N., the end product in which the stookman is chiefly interested, is shown in next to the last line of Tables 3,4, and 5. All of the data in this report pertaining to Total Digestible Nutrients (T.D.N.) &re based on pastures where 90% or more of the animal T.DIIN. are not Consequently the data on units pastured were dairy cows. based on the same number of records as the data on costs and animal unit days of grazing. The number of reoords for whioh T.D.N. data were available are shown in parentheses in the last line of Tables 3,4, and 5. The amount of grazing yielded by non-irrigated pastures in Oregon is strongly influenced by the amount of rainfall during the pasture season. Particularly is this true of native hill pastures in Western Oregon, many of which are on shallow soil which has a low moisture holding capacity. During the 1934 pasture season (April to September inclusive) precipitation in both the Willamette Valley and Coast areas was considerably below the normal rainfall for this period. In fact there have been but 3 other years (1909, 1018 and 1024) during the last ZB years with such low precipitation during the pasture season. Because of this lack of rainfall the yields of pasturage for non-irrigated pastures, as shown in Tables 3 and 5, are probably below normal, thereby causing the cost per feed unit to rise above normal. Partiularly is this true for pastures which happened to be on soils with a low moisture holding capacity. Willamette Valley Area The farm pastures studied in the Willamotte Valley area have been grouped into 4 classes; namely, permanent native grass, permanent and semi-permarnt seeded tame grass, permanent and semi-permanent leumos, and annual seeded pastures. These four o13sses have bean further broken down into 10 sub-classes, on the basis of the predominating forage cover. The annual maintenance cost per acre, th total animal unit days of grazing per acre, the pounds of Total Digestible Nutrients produced per acre, the cost per animal unit day of grazing and the cost per 100 pounds of Total Digestible Nutrients for each pasture sub-class is presented in Table 3. * The T.D.N. produced by pastures has been computed by ascertaining the net T,D.N. requirement for animal maintenance and milk production, allowance being made for nutrients supplied by supplementary feed. The T.DN. requirements used are based on Hacoker's feeding standard. The amount of TID.N, in supplementary food was evaluated at 50 per cent for roughage, 15 per cent for suoculents, and 75 per cerrt for eoncentrates. L.BLE 3. AVERAGE NNtLL COST PER iCRE OF MLINTAi NIiG FARM PASTURES 229 Pastures, 7illomette Valley 1934 Pasture Season >errnanent end seril-perman- Peanent end scrii-per- ?ermnent nient native grass ient seeded tome grasses Native Nativ grass grass 50- Rye 75Canary Mixed Alfalfa l0 74% rass grass grass Item Totel number of records Acres of actual pasture Aores of actual pasture per farm Animal unit dajof grazing ' 76 13 724 7340 96 £9524 .01 .01 - 56 59672 3 NET COST PER ACRE .43 3.93 64 053 iI1 Pounds of TD.N. per acre 68 93 64 9 32 10 75 8 0619 24409 152537 3 .07 16231 31.83 9 - Fertilizing Seed bed preparation Seed and seeding Cultivating * Weeding and clipping Irrigation (labor & rtter) Fence (upkeep, intorest & depre.26 ciation) Miscellaneous operations .02 Drainage tax Depreciation of stand Taxes on land .75 Interest on land investment @s% .38 TOTJ, COSTS PER ACRE ),43 * Credit for hay or seed Animal unit days of grazing per acre Cost per animal unit day of graz- 16 415 26 3 - .G - 4]. 1331 Red and alsiko clover Z0 327 16 56506 3 .26 Ladino clover irrigated 8965 - - .04 .44 .02 .40 .21 1.00 3.46 1.13 2.50 1.62 6.13 .84 .17 .32 .87 1.61 4.99 7.76 10.24 - 5.68 13.68 - 9.14 .00 .30 10.24 5.68 13.68 82 98 290 115 .048 ** 064 .035 2610 .050 1705 - .01 - .28 .04 - .62 - .70 2.86 .37 .26 .85 3,93 .30 * - 587 ,54 1.14 .14 1.98 6.30 .04 - .01 .20 6.17 .86 8 3- 610 32 62118 .04 535 244 2.16 .09 1.06 .01 .62 .32 3.27 1.73 Rape, rape and clover Regional average tS 71036 3 .45 .01 - - grass 63 .39 .08 - - .19 Sudan 17 .07 .05 pastures_ 216 13 - - - F.nnual seeded leime pastures - 11185 49 961617 3 .04 .17 .10 * * .01 - .01 .12 .40 - .34 .02 .06 15 .89 2.92 .96 3.03 1.35 3.87 20.77 - 12.22 9.17 - - 8.34 20.77 12.22 9.17 4.79 216 173 329 142 102 86 .063 1412 .94 .048 1991 .36 .063 4054 .60 .086 1813 .64 .089 .056 1702 .58 ** ** 4.82 .03 ** Cost per 100 pounds of T,D.N. .47 ,5 Number of r ecords used in T.D.N. ** ** (53)_ computations (4) (9) (8) (5) 9) 4) -* Loss than ** Data insufficient Note: The stije sub-classes shown above are based on the fact that 60% or more of the cover vias of the typo named. Where no on,tRecies contjtutos as much as 50% of the cover the pasture has been classed as a mixed grass type. (5)(9)_ 6. In studying Table 3 it should be borne in mind that these are preliminary figures only and that sufficient data are riot yet available to warrant olose comparisons between the various pastures. In the last column of Table 3 are shown the combined or average costs for all types of pastures studied in the Wil1iette Valley. Since this is a weighted figure it is, of course, strongly influenced by the costs shown for permanent native grass pasture, as this is the predominating type of pasture in this area and was the predominating type in the sample studied, It is believed, however, that this average fairly represents the pasture cost situation in the Willamette Valley. A study of these regional costs shows that about 60 percent of the annual maintenance cost consisted of interest at 5 percent on the estimated value of the farm pastures. Nineteen percent consisted of taxes, 7 percent was chargeable to fenoc cost, arid the remaining 14 percent covered such items as seeding, irrigation, depreciation of stand, etc. Whi1 these percentages vary somewhat for the various pastures, it is noteworthy that, excepting ladino clover and sudan grass, the interest and taxes in each case constitute 57 percent or more of the total gross of the 10 pastures constitute over maintenance cost per acre, and for Willametto Valley 70 percent of the gross annual maintenance coat. farmers as a group appear to be very conservative with expenditures for such items as fertilizer, re-seeding or stand maintenance, cultivation, and weed control, all of which are conducive to pasture betterme nt, Table 3 brings out rather definitely the cost advantage most pastures usually have over dry feed. With grain at 25 a ton and hay at l0 a ton the cost per hundred pounds of total digestible nutrients in grain and hay is l.67 and l.00, respectively. Most of the pastures studied were providing digestible nutrients at costs substantially in addition to tho cost advantage there are other under these figures. advantages to be considered which favor pa.sture over dry feed, such as saving in labor, greater palatability, increased rate of growth of young animals, particularly lambs, and increased milk production of cows and When all of these factors, including comparative costs, are conewes. sidered it would appear that ample pasturago is a factor of great economic importance to Willaxnette Valley dairnen and stockmen. The use of irrigated lndirio pasture, which is a fairly recent development, has been considered by many as the beginning of a new era in Willamette Valley livestock farming. The preliminary data shown in Table 3 indicates that, from a cost standpoint, ladino clover is Practically slightly more expensive than several other types of pastures. all pastures except native grass and alfalfa produced digestible nutrients at costs comparable to or loss than the cost of producing these nutrients by use of irrigated ladino clover. Several things should be pointed out in this connection, however. First, irrigation of pasture, oven though slightly more costly, is usually the most practical way of insuring a continuous supply of forag throughout the season. Second, yields of T,D.N per acre are aut 7. twice as large for irrigated ladino as for most non-irrigated grass or legume pastures and hence stock can be pastured on less land, Third, almost any type of soil can be used for ladino if water is available, whore many other pastures suoh as canary grass, red and alsike clover, and alfalfa are rather selective as to types of soil. Many Willametto Valley stock farms do not have a supply of irrigation water available, and hence cannot be irrigated. In many instances, however, such farms can produce a considerablo quantity of pasture by using a carefully selected sequence of pasture crops. Alfalfa has especial value in such a sequence for it will usually provide late suximier and early fall pasture after other pastures have dried up. It is believed that many Willaxiiette Valley livestock farmers could well afford to give careful consideretion to improving their pastures with the resources they have available rather than to hesitate because irrigation may not be praotioal on their farm. Eastern Oregon Irrigated Region Native blue grass is the predominating irrigated pasture in the In many instncc-s such pastures are areas studied in Eastern Oregon. the residue from former alfalfa fields or seeded pastures. Meadows and pastures in this area usually revert to blue grass if left alone for any length of time. Costs and carrying capacities for these two pasture types are presented in Table 4. The per acre annual maintenance costs are about 100 percent greater f or mixed seeded than for native bluegrass pasture. TABLE 4. AVRAGE ANNUAL COST P AChE OF vL4INTAINING FARM P\STURES 76 Pastures, Eastern Oregon Irrigated Region 1934 Pasture Season Item Total number of records Acres of actual pasture Acres of actual pasture per farm Animal unit days of grazing Native blue grass 5 212 37 3l5il .40 Fertilizing .01 Seed bed preparation Seed and seeding .03 Cultivating .03 Weeding and clipping .63 Irrigating (labor only) depreciation 48 Fence (upkeep, interest and .08 Miscellaneous operations .97 Irrigation water Drainage tax Depreciation of stand 1,08 Taxes on land 3.37 Interest on land investment (5 percent) ocdeä mixed Regional grass average 17 115 7 34O4 2.34 .05 .04 .01 .22 1.55 1,54 - 2.96 .10 .68 1,61 4.35 76 2307 30 34696 .50 .01 * .03 .04 .88 .53 * 1.07 .08 .03 1.10 3.42 CRE Credit for hay or seed 7,06 15.45 1.13 7.49 .02 NET COST PER ACRE 7.06 14.32 7.42 Animal unit days of grazing per acre 144 .'49 297 152 1,082 .54 3,280 1,324 .44 .51 (5) (ii) TOTAL COSTS Pbki Cost per_animal_unityofrazin Pounds of T D N per acre Cost per 100 pounds T D N Number of records used in T D N Computations (6) .07. Q8 *Le than .5 cent **Data insufficient The pasture classes shown above are based on the fact that 50% or more Note: of the cover was of the type named. 1IThere no one plant species constitutes as much as 50% of the cover the pasture has boen classed as a mixcd grass type. 9. Farmers with seeded pastures expended considerably more per acre for such items as fertilizing, reseding and weed oontrol than farmers Also they appeared to irrigate more, with native blue grass pastures, as is indicated by the comparative labor charge for irrigating. Overhead charges such as interest, taxes, irrigation district tax, stand depreciation and fønoe costs were also higher for seeded than for native pastures, However, seeded pastures produced about 3 1/3 times as much nutrients per acre as the native pastures, which more than offset the higher per acre costs incurred and resulted in a lower cost per 100 pounds of total digestible nutrients. Coast Regions In the Coast region the principal source of pasturage is found in the bottom and tideland pastures. These pastures are chiefly mixed grasses, but some are predominantly bent grass or canary grass. Associated with these bottom land pastures are considerable acreages of hill pasture, some of which have been seeded and partially improved. The hill pastures usually have a rather low carrying capacity while conversely the bottom land pastures have an exceptionally high carrying capacity. Data pertaining to maintenance costs and carrying capacity of A very noticeable feature of coast pastures are presented in Table 5. bottom land pasture costs in this area is the high costs for interest and taxes. For the 57 bottom land pastures studied in this region those two annual costs amounted to nearly *14 an acre of which about 30 percent was for taxes. 10. TABLE 5, AVERAGE ANNUAL COST PER -CRE OF MAINTAINING FARM PASTURES 68 Pastures,, Coast Region 1934 Pasture Season Bc)ttomLandturcs ut* Hill pasture grass Item Total nujaber of records Acres of actual pasture Acres of actual pasture per farm Animal unit days of grazing Depreciation of stand Taxes on land Interest on land investment grass 1]. 12 6 408 34 172 29 54072 65248 50236 39 1214 31 262602 .05 .74 .07 .04 - 08 - - .05 .06 .03 .03 .23 - .36 .03 .52 .20 Regional average 68 2472 36 432158 $ .40 .28 .14 .05 .08 .04 .20 .08 1.12 .06 .72 .14 .61 .12 - - - .01 - 1.32 .02 .11 - - - tainage tax Mixed grass 678 62 .14 .05 .21 Fertilizing Seed bed preparation Seed and seeding Cultivating We2ding and clipping Irrigating (labor only) Fence (upkeep, interest & depreciation) Miscellaneous operations Irrigation water Can* .12 - - - - 3.33 7.54 5.30 8.50 4.42 8,71 4.02 9,95 TOTAL COSTS PER ACRE Credit for hay or seed 3.86 14.61 15.80 16.20 12.56 .09 .34 NET COST PER ACRE 3,86 14.78 15.80 15.51 12.22 .62 5% 2.33 -.03 - Animal unit days of grazing per Cost per animal unit day of grazing $.048 160 .092 292 ,O54 216 ,072 175 .O69 ** ** 1196 l.17 2979 2132 2021 $ .53 76 77 ** (6) acre Pounds of T.D.N. per acre Cost per 100 pounds T.D.N. Number of records used in T,D,N. computations 80 (4) (19) (29) * Less than .5 cent ** Data insufficient * These pasture c1asse are based on the fact that 50% or more of the cover w of the type named. Ithere no one plant species conatitutes as much as 50% of the cover the pasture has been classed as a mixed grass type. Cash and Non-cash Costs of Maintaining Farm Pastures 11. Only a portion of the annual costs of maintaining farm pastures are direct cash or out-of-pocket costs. Items such as the labor of the operator or his family, depreciation, and interest on the pasture investment (if free of mortgage) are frequently considered as non-oash or deferrable costs for usually they do not require payment at any specific time, In this study all interest was charged as a non-cash cost as data were not available to indioate the indebtedness chargeable to pasture investmerit. The annual maintenance costs for the 373 pastures covered by this study have been segregated into cash and non-cash groups in Table 6. Cash outlay is shown to be 25 per cent, 36 per cent, and 22 per cent, rospectively, for the Willainetto Valley, Eastern Oregon irrigated area, and Coast regions. Cash costs . d not exceed 40 per cent of the total inaintonance costs for any of the 16 types of pas- ture listed in the first column of Table 6, and for 8 of the 16 pastures, cash costs were 25 jer cent or less. aside from all the advantoges previously noted in favor of pasture over dry feed, there is an added advantage in the low cash cost of pasture. The cash cost of producing hay and grain svcrages about 50 per cent of the total cost, while the cash cost of pasture averages about half of this anint, Hence an abundance of pasture makes possible a feed supply at a great saving in direct cash outlay. During periods of low livestock or butterfat prices this is an important financial factor. CASH AND NON-CASH COSTS OF MA INTAIN ING FAR PASTURES TABLE 6. 373 Pastures, All Regions, 1934 Pasturo Season Ch c'sts per acre Non-cash costs per acre ______I V V Mis eel- Region and kind of pasture Hired labor V WILLAMETTE VALLEY Native grass 75-1Oc Native grass 50-74% Rye grass Mixed grass Canary grass lfalfa Red alsike clever Ladino clover irrigated Sudan grass Rape, rape and clover Regional average lancous cash expense' Total cash costs 3 .75 .70 1.26 1.00 1.98 1.62 1.61 1,73 3 .05 3 .82 .07 .29 .47 .68 .95 .65 2.68 .0 .96 1.35 .o9 2,64 1.82 .30 1,08 1.61 1.10 1.13 3.30 1.25 Taxes j Unpaid Credit Not for Cash fcthly hay costs labor Dopreciation I I 3 .02 .03 .01 .02 .37 .08 .11 .51 .25 .05 1.56 1.49 3.03 2.65 2.37 4,92 3,60 3.42 1.24 * .80 - .03 3 .04 3 .82 .80 1.5t 1,49 3.03 2.65 1.57 4,92 1 360 3.421 1.214 .07 .07 .08 .32 .39 .26 1.45 2,11 .61 .13 $ .12 .14 .67 .48 .40 3.44 1,29 5.44 .95 .60 .37 cellaneous jTotal Total non- cost nonInter-cash cash: per est**costscosts 32.44$ 2,92 4.00 3.58 6.49 6.59 5.18 8.83 3,42 4,09 3.02 .44 .14 .42 32,61133.43 3.13 3.93 .01 4.'14t 6.30 * 4.19 5.68 7.21 10.24 11.03 13.63 8.34 6.77 15.85 20.77 8.62 12.22 .05 .61 .04 .13 2.14 575 9.17 .45 .06 353'79 V V EASTERN OREGON IRRIGATED R EGION Flue grass Mixed grass _Regional average acro 2.65 5,05 3.49 4.79 .48 .27 1.72 .34 36 .26 1.93 ,34 .26 .70 .17 ,21 .46 .22 .33 .28 .57 .31 2.43 10.09 8.58 8.87 7.65 .15 .57 .02 .06 .33 1.13 2. 6 3.92 .41 1.96 .07 2.7ç .02 4.43 7.06 10.40 14.32 4.72 7.42 V COAST REGION Native hilT pasture Mixed grass Bent grass mary _Regiona average .05 .22 .41 .10 .20 .62 4.02 5.30 4.42 3.32 .13 .27 .05 1.57 .29 .80 4,51 5.76 6.09 3.81 .69 .03 .34 .80 3.821 5,731 6.09 3.47 3a06 3.86 11.6915.51 9.O5 14.78 9.71115.80 _8.75il2.2Ji * Less than -?- cent ** Includes interest on both land end oquipmont investment chargeable to pasture. 4 Includes such items as drainage tax, seed, electricity for irrigating, fuel and oil, repairs to fence and equipment and connnercjal fertilizer. 4* Chiefly horse labor and manure. 13. Individual Farm Costs The last page of this report consists of a confidential tabular report to eoh cooperating farmer, showing the annual maintenance costs for each pasture on which such costs were reported. These oost may be compared to the average costs for similar pastures in the acme region by referring to the page of the report indicated at the bottom of the table. Such comparisons will indicate where pasture costs are above averge and should also indicate possibilities for reducing costs. 14. Oregon Agricultural Experiment Station PASTURE COST STUDY INDIVIDUAL COST REPORT FOR THE YEAR 1934 onfidentTT) !oiri1 .°L YOUR ITEMS PASTURE TOTAL ACRES IN PASTURE ACRES OF ACTUAL PASTURE A. U. DAYS R ACRE ACTUAL PASTURE ITEMIZED COST PER ACRE: Fertilizing Soil Preparation Seeding Cult ivati rig Wee ding Irrigating Fence Mis cc ilane ous Depreciation of Stand Taxes Interest on Land Credit for Hay or Seed TOTAL NET COST PER ACRE COST PER ANIMAL UNIT DAY The cost and carrying cr'pacity of your pasture, as shown above, may be compared with the average for pastures of similar type in your region by referring to Table of this report.

