Integration Intuition
advertisement
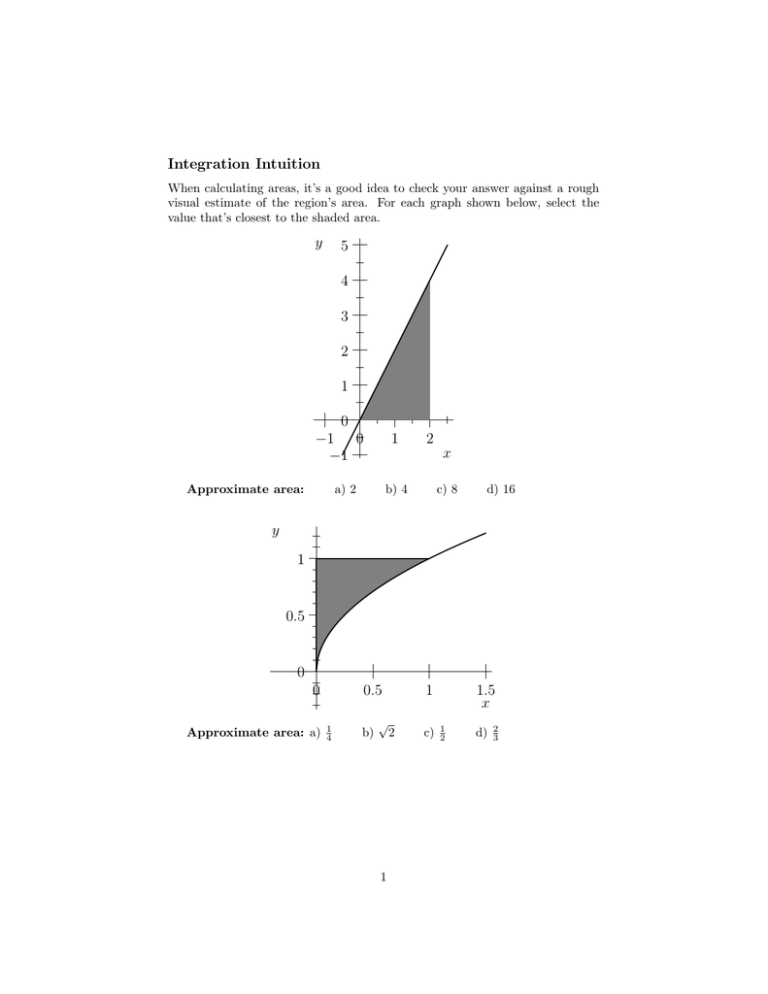
Integration Intuition When calculating areas, it’s a good idea to check your answer against a rough visual estimate of the region’s area. For each graph shown below, select the value that’s closest to the shaded area. y 5 4 3 2 1 0 −1 0 −1 Approximate area: 1 a) 2 2 b) 4 x c) 8 d) 16 y 1 0.5 0 0 Approximate area: a) 0.5 1 4 b) √ 2 1 1 c) 1.5 x 1 2 d) 2 3 y 3 2 1 0 0 Approximate area: a) 1 1 2 b) 3 4 x c) 3 2 d) 2 Solutions Graph 1: The shaded region is a triangle with base 2 and height 4, so its area 1 is · 2 · 4 = 4 and the answer is (b). The scale on the x and y-axes is important 2 in estimating the area of a region. Graph 2: Drawing a diagonal between (0, 0) and (1, 1) we see that the shaded region fits inside a triangle with area 12 . This rules out answers (b) √ and (d). (Don’t be intimidated by numbers like 2 and π. Learn their values, rounded off for use in estimation.) Either of answers (a) and (c) is reasonable. By comparing the shaded area to that of a square with area 14 , we might conclude that (c) is the best answer. Graph 3: This region is comparable to a rectangle of area 12 topped by 1 one of area 4 , so the best answer appears to be (b). A common error in this problem is to consider only the height of the region, assuming that the width of its base is 1. 2 MIT OpenCourseWare http://ocw.mit.edu 18.01SC Single Variable Calculus�� Fall 2010 �� For information about citing these materials or our Terms of Use, visit: http://ocw.mit.edu/terms.
