From: ISMB-97 Proceedings. Copyright © 1997, AAAI (www.aaai.org). All rights reserved.
Functional Prediction of B. subtilis
Genes
From Their Regulatory Sequences
lTetsushi
Yada
Japan Science and Technology
Corporation
5-3 Yonbancho, Chiyoda-ku,
Tokyo 102, Japan
yada@tokyo.jst.go.jp
Yasushi
Totoki
Information
and Mathematical
Science Laboratory, Inc.
2-43-1 Ikebukuro, Toshima-ku,
Tokyo 171, Japan
totoki@imslab.co.jp
Abstract
In bacterial cells, gene expression is regulated
by multiple sigma factors, each of which has its
promoter specificity,
according to their conditions. Thus, if we can discriminate which sigma
factor binds to the upstream region of a given
coding sequence, we can predict in what condition it will be expressed. In this paper, we
show this approach is feasible for the analysis of
Bacillus subtilis genome. Based on our collection of known promoter sequences, we prepared
8 predictors to characterize knownsigma factors
using the hidden Markov model and their prediction accuracies were estimated with a crossvalidation test. Furthermore, we predicted the
sigma-dependencies for each of 1415 candidate
genes in the genome. Our prediction results are
experimentally testable and seem useful for the
post-sequencing project.
Introduction
Since a number of bacterial
genomes have been sequenced, there are great demands for practical computational methods to interpret their biological contents.
Although it is relatively easy to locate their candidate
genes (Yada & Hirosawa 1996), it is very difficult
infer their function when no similar sequences were
found in databases. In this paper, we propose a new
approach for the interpretation
of bacterial genome sequences: prediction of gene function from its regulatory sequences (a pioneering
work has been done in
yeast (Fondrat & Kalogeropoulos 1994)).
It is well-known that all bacterial genes are not expressed all the time; their expression is regulated with
respect to various conditions.
As for its molecular
mechanism, the use of multiple sigma factors
seems
the most fundamental.
Sigma factor is a subunit of
RNApolymerase that determines its promoter specificity (Lewin 1994). For example, when a bacterium
in the condition of high teinperature,
it synthesizes a
specific heat-shock sigma factor and then RNApolymerases synthesize
the mRNAsof genes dependent on
tCopyright ©1997, American Association for Artificial
Intelligence (www.aaai.org). All rights reserved
354
ISMB-97
Takahiro
Ishii
and Kenta
Nakai
Institute for Molecular and
Cellular Biology, Osaka University
1-3 Yamada-oka, Suita 565, Japan
{ishii,nakai}@imcb.osaka-u.ac.jp
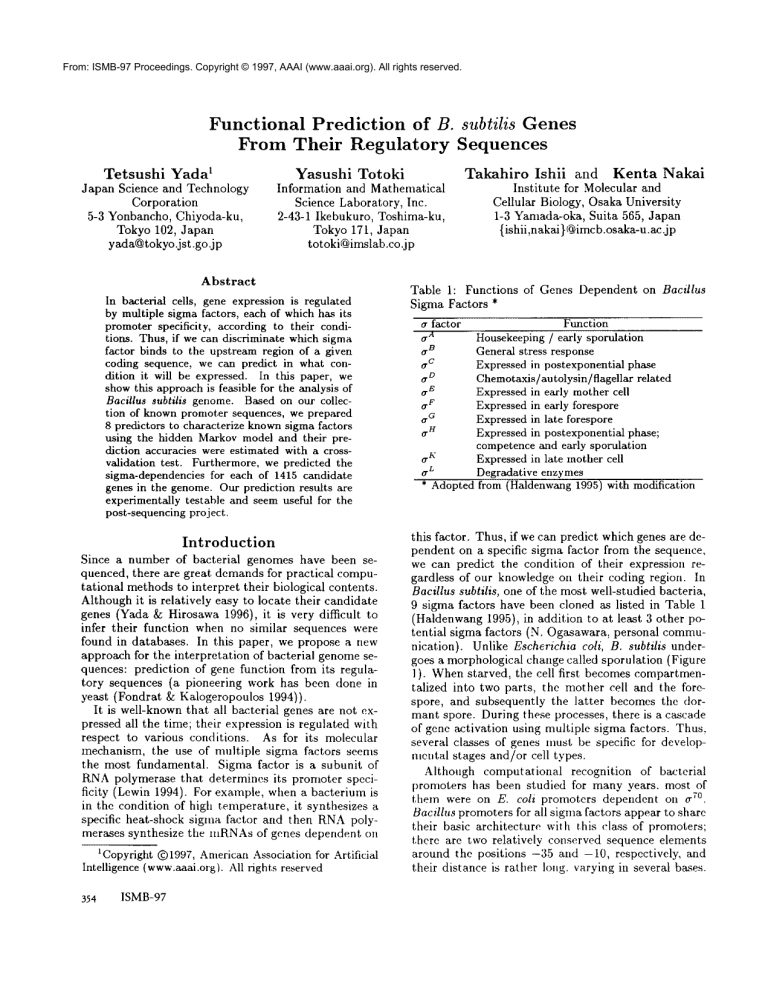
Table 1: Functions
Sigma Factors *
of Genes Dependent on Bacillus
Function
Housekeeping / early sporulation
General stress response
c
O.
Expressed in postexponential phase
D
O.
Chemotaxis/ au tol ysin / flagell ar related
E
O.
Expressed in early mother cell
F
OExpressed in early forespore
.G
0
Expressed in late forespore
H
O.
Expressed in postexponential phase;
competence and early sporulation
K
(7
Expressed in late mother cell
L
ODegradative enzymes
* Adopted from (Haldenwang 1995) with modification
a factor
A
OB
tT
this factor. Thus, if we can predict which genes are dependent on a specific sigma factor from the sequence,
we can predict the condition of their expression regardless of our knowledge on their coding region. In
Bacillus subtilis, one of the most well-studied bacteria,
9 sigma factors have been cloned as listed in Table 1
(Haldenwang 1995), in addition to at least 3 other potential
sigma factors (N. Ogasawara, personal communication). Unlike Eschevichia coil, B. subtilis undergoes a morphological change called sporulation (Figure
1 ). When starved, the cell first becomes compartmentalized into two parts, the mother cell and the forespore, and subsequently the latter
becomes the dormant spore. During these processes, there is a cascade
of gene activation using multiple sigma factors. Thus.
several classes of genes must be specific for developnteutal stages and/or cell types.
Although computational
recognition
of bacterial
l)romoters has been studied for many years, most of
them were on E. coli z°.
promoters dependent on tr
Bacillus promoters for all sigma factors appear to share
their basic architecture
with this class of promoters;
there are two relatively
conserved sequence elements
around the positions -35 and -10, respectively,
and
their distance is rather long. varying in several bases.
(a)
(b)
i.t; ....o"
0
septum
forespore
O
GF...-~ G
spore
Figure 1: Sporulation processes of B. subtilis. (a) First,
the septum divides the cell into the mother cell and the
forespore. (b) Next, the spore is engulfed and is surrounded
by the spore coat. During these processes, somestage- and
cell-type-specific sigmafactors are activated. (c) After the
lysis of the mothercell, the spore is released.
Because of the existence of this large gap, it is difficult to directly apply standard pattern-recognition
techniques such as the weight-matrix method. In
this study, we used the hidden Markov model, HMM
(Krogh et al. 1994; Yada, Sasuka, &: Hirosawain printing), with which we can naturally treat the gap region.
Since another difficulty for promoter recognition is the
existence of extensive false positives (Horton ~ Kanehiss 1992), we tried to avoid this problemby restricting
the search region. In this paper, we report howthe discrimination of sigma-factor binding sites can be useful
to predict the gene function identified in a large region
of genomic sequence.
Materials
and Methods
Data Collection
and Preprocessing
A set of promoter sequences were collected for each
sigma factor from the literature (Table 2). Most of the
collected promoters were experimentally verified but
some of them were adopted by sequence homologyonly.
To make up for the small size, promoter sequences for
homologousfactors of other bacteria were also included
for qB, o_D and 0 "L. Our collection were used as the
training data and are available upon request.
As for the test data, upstream non-coding sequence
segments starting from position -1 of any annotated
gene (ORF, tRNA, or rRNA) of length 200 bp at most
were collected from the 1.4 Mbpgenomic sequence
determined by the Japanese Bacillus genome project.
Whenthere is no in tergenic sequence in the upstream
region, it is treated as "no promoter" (173 cases). Most
of them are likely internal genes within operons. The
total number of the test data was 1415. Their matching with the training data was examined using the
BLASTN
program (Altschul et al. 1990).
To construct HMMs,collected promoter sequences
were multiply aligned using the tree-based round-robin
iterative algorithm (Hirosawa et al. 1995). Then, the
significance of conservation was tested at each position
using a X2 test. The threshold significance used was
Table 2: Summary of Collected Promoters. In the
2nd column, numbersafter the plus sign means the ones
adoptedfrom other species; in the 3rd column,typical conserved segments corresponding to the -35 and -10 regions
are shownrather arbitrary.
Number
Consensuspattern
a factor of data
-35 spacer (bp) -10
A
a
142
TTGA 14 TGNTATAATA
m
a
10+ 1
GTTT 16 GGGTAT
D
a
11+ 18 MTAAAST12 TGCCGATAW
aE
18
KCATANT14 CATACANT
car/a
15
GNATAA17 CANANTA
H
a
AGGATNT14 GAAT
I0
K
(r
13
ACM16 CATANNNT
L
a
3+ 8
TGGCAC 5 TTGCNT
0.1% for erA-dependent promoters, whose number is
exceptionally large, while 1.0 %was used for the others.
Hidden
Markov
Model
Based on the alignment of the maximumsegment, an
HMM
was built for each sigma factor. Its basic architecture is shownin Figure 2. It is a tied, left-to-right
HMM
without internal loops. Corresponding to position i of the alignment where the conservation is significant, two kinds of states, a match state Mi and a
deletion state Di were prepared. On the other hand,
in position j where the conservation is insignificant,
an insertion state Ij and a deletion state Dj were prepared. Mi and Ij output the four symbols A, C, G,
T. To avoid over-learning, the output symbol distribution of insertion states were tied and their initial
values were set to the base frequency of each insignificant region. Other initial parameter-values were also
defined from the conditional probabilities calculated
from the alignments in the way described in Yada et al.
(in preparation) and they were further optimized using
the Baum-Welchalgorithm. Note that our model is designed to restrict the number of adjustable parameters
to almost the same level with a weight matrix when
transitions to the insertion states are not occurred in
the significant regions.
Given a sequence segment, every subsegment whose
logarithmic likelihood exceeds a pre-defined cut-off
value is reported for each HMM
using "local search",
based on the Viterbi algorithm. To compare the values
for HMMs
corresponding to different sigma factors, the
likelihood xi,j of a subsegment j detected by HMM
i
is transformed
to a z-scorez.H.,j (Zi, jH = (Xi,j Xi)/si,
where the mean value )(i and the standard deviation
si were calculated from the genomic data). When
HMMs
are applied to potential regulatory regions in
the genome, this z-score was modulated according to
the distance from the starting site of the downstream
coding region. Weassumed that the distribution of
Yada
355
Figure 2: Architecture
of HMM.Circles, squares, and
diamonds represent match, deletion, and insertion states,
respectively.
5’ UTRlength, i.e., the length of untranslated region
between the initiation
sites of transcription
and translation, follows the Poisson distribution (see Results).
Thus, for a subsegment at the position of distance Lj,
the z-score for the positional effect is calculated with
this formula, z D. = (L~~ - #i)/~/-~, where #i is the average distance
lgetween the
3’ end of HMMi and the
5’ end of the downstream coding region. Finally,
we
defined the score zi of sigma factor i for a given gene
as z, = maxj{z H -IziDI}.
Estimation
of
Predictability
To estimate the discrimination ability for these HMMs,
a cross validation
test was performed. For (r A- and
aD-dependent promoters, one-tenth
of the data and
2 sequences, respectively,
were randomly chosen as a
test set in each trial.
These trials were repeated until each sequence is selected 10 times on average. For
the other promoters, 1 sequence was used for a trial.
The predictability
was evaluated both from the sensitivity and the specificity.
For the sensitivity
evaluation, two criteria
were used. In the "Approximate"
criterion, cases are counted to be correct when the correct HMM
marks a largcr likelihood than its minimum
value in the training data. In the "Rigorous" criterion,
cases are counted to be correct when the correct HMM
marks the maximum z-score among the scores of all
HMMsand when it satisfies
the former condition.
For
the specificity
evaluation, averaged number and standard deviation of apparently falsely-responded
HMMs
per gene is calculated for each class of data although
our data are still likely to include yet-uncharacterized
promoters.
Results
Estimation
of
and
Discussion
Predictability
Amongthe sigma factors in Table 1, ~r C was not considcred because its in-vivo recognition sites are still
unknown, while the ~r F- and ~rC’-dependent promoters
were combined into one class because their recognition sites seem to largely overlap. Table 2 summarizes
our data used. Except for (r a- and ~rO-dependent promoters, their data sizes are rather small and data for
356
ISMB-97
Table 3: Results of Cross Validation.
Sensitivity
Specificity
a factor
Approx. Rigorous
A
O0.99 + 0.93
99.2 % * 83.0 % *
-B
O
0.82 -I- 0.39
54.6 %
54.6 %
D
(T
83.5 %
0.83 d: 0.84
87.9 %
E
dr
5,5.6 %
1.33 + 0.75
55.6 %
G
o’F/~
60.0 %
60.0 %
1.73 -t- 0.93
H
O,
50.0 %
50.0 %
1.10 + 0.70
K
O.
61.5 %
61.5 %
1.46 -t- 0.50
L
O.
72.7 %
72.7 %
0.73 -4- 0.75
75.5 %
1.05
Total
85.2 %
* Standard deviations on approximate and rigorous criteria are 2.7%mad 8.3%, respectively.
~r D and O"L largely include the sequences from other
species. Some positions other than the so-called -35
and -10 regions were also conserved in ~r A- and ~D_
dependent promoters which are large in size. The conservation degree of the c~L-dependent promoters appeared to be the highest. Based on the derived alignments, 8 HMMswere constructed.
The changes of the
parameter values from their initial values were rather
small during the optimization procedure.
The cross validation test was performed as described
above. The alignments
were rather stable in many
cases when sequence(s)
of test data were excluded.
In Table 3, the results for the sensitivity
are shown.
The results were identical
in the two conditions except for aA and O"D and the ranking of sensitivity
roughly reflects the ranking of data size. Since we do
not know the relative
frequency of various promoters
in the genome and since we have not characterized all
sigma factors yet, the exact estimation of total predictability is difficult.
If we simply estimate it by the
ratio of correct predictions, they were 85.2 % an(] 75.5
% for the "Approximate" and "Rigorous" conditions,
respectively
(for ~r A and CrD, average numbers were
used). Table 3 also shows the result for the specificity
evaluation.
The crL promoters, again, show a marked
result probably due to their strong conservation. All of
sporulation-specific
promoters (~r E, o~/~ ~, K)
and (r
showlower specificity. It is likely that their recognition
sequences more or less overlap like the cr F- ~and (r
dependent promoters which we treated as one group.
Such similar recognition sequences clearly provide the
bacteria with a subtle way of controlling
the geneexpression level in sporulation.
Considering the possibility of multiple recognition-sites,
our result seems
rather satisfactory.
Moreover, since the cr ~ D,
and (r
both of which are relatively
abundant in data sizes,
show better sensitivity,
we can expect that the future growth of our training data will improve the predictability significantly.
Table 4: Sample Prediction Result for Each Sigma Factor.
~r factor
aB
"o
o
E
a
"a
o’F/o
"H
0
~"
a
L
Or
Rank
11
16
5
12
10
2
2
Score Gene
2.35 yfhN
1.81 tlpC
2.68 nucB
2.20 yqjW
1.97 yyaA
2.72 gerKA
4.33 yfjK
Description
expression induced by environmentalstress
methyl-accepting chemotaxis protein.
sporulation-specific extracellular nuclease precursor.
similar to SamBprotein for UVprotection and mutation
strong similarity to spoOJ
spore germination protein GerKA
probable acetoin dehydrogenasesubunit
Application
to Genomic Data
Weapplied the obtained HMMs
to the sequences of upstream region taken from the genomic data. Wefirst
examined the positional distribution of 67 promoters
involved in both the training data and the genonfic
data. 85 % of the data were distributed
under the
5’UTRlength 125 and the average in this range, 45.7,
seems to fit the Poisson curve well. Based on this observation and the fact that about 50 bp is needed for
IIMMs, we used a maximumlength 200 bp when we
extract the upstream non-coding sequence.
Each upstream sequence was evaluated by 8 HMMs
and their z-scores were subtracted by the z-scores representing the positional effect; we confirmed that the
result is not drastically changed even if we omit this
term (data not shown). In Table 4, a typical result not
involved in the training set is shown for each sigma
factor except erA. For example, since erD mainly regulates genes related to chemotaxis, the prediction that
the tlpC gene is regulated by erD seems very likely. Although some genes were apparently contradicting our
training data, it is possible that they are only the resuits for unknownalternative promoters.
Concluding
Remarks
Previous attempts to detect the binding sites of various sigma factors have been "at best problematic and
sometimes misleading" (Harwood & Wipat 1996).
this study, to someextent, we could overcomethis situation (1) by collecting as manypromoters as possible and re-evaluating the aligmnents (2) by using the
HMM
that is far more elaborate than "eye-balls" (3)
by restricting the search area based on the statistical
analysis and (4) by performing a systematic analysis
of genome-scaled data.
We are now studying the entire E. coil genome
with the same approach. Further incorporation of our
knowledge on other activators/repressors and the collaboration with the groups of B. subtilis and E. coil
post-sequencing projects will be promising for our understanding of the gene-regulation network.
Acknowledgments
The authors thank Naotake Ogasawarafor relevant discussions and for letting us use the unpublished data of
his group. This project is partly supported by the
ALIS project for genome analysis of JST and by a
Grant-in-Aid (GenomeScience) for Scientific Research
on Priority Areas from The Ministry of Education, Science, Sports, and Culture in Japan.
References
Altschul, S. F.; Gish, W.; Miller, W.; Myers, E. W.;
and Lipman, D. J. 1990. Basic local alignment search
tool. J. Mol. Biol. 215:403-410.
Fondrat, C., and Kalogeropoulos, A. 1994. Approaching the function of new genes by detection of
their potential activation sequences in Saccharomyces
cerevisiae: application to chromosomeIII. Current
Genet. 25:396--406.
Haldenwang,W. G. 1995. The sigma factors of Bacillus subtilis. Microbiol. Rev. 59:1-30.
Harwood, C. R., and Wipat, A. 1996. Sequencing and
functional analysis of the genomeof Bacillus subtilis
strain 168. FEBSLetters 389:84-87.
Hirosawa, M.; Totoki, Y.; Hoshida, M.; and Ishikawa,
M. 1995. Comprehensive study on iterative
algorithms of multiple sequence alignment. Comput. Appl.
Biosci. 11:13-18.
Horton, P. B., and Kanehisa, M. 1992. An assessment of neural network and statistical approaches for
prediction of E. coli promoter sites. Nucl. Acids Res.
20:4331-4338.
Krogh,
A.;Brown,
M.;Mian,I. S.;SjSlander,
K.;and
llaussler,
D. 1994.HiddenMarkovmodelsin computational
biology,
applications
toprotein
modeling.
J.
Mol.Biol.235:1501-1531.
Lewin,B. 1994.Genes.OxfordUniversity
Press,5th
edition.
Yada,T., and Hirosawa,M. 1996.Generecognitionin Cyanobacterium
genomicsequence
datausing
the hidden Markov model. In Proc. of the ~th Int.
Conf. on Intelligent Systems for Molecular Biology,
252-260. Menlo Park, Calif.: AAAIPress.
Yada, T.; Sazuka, T.; and Hirosawa, M. in printing.
Analysis of sequence patterns surrounding the translation initiation sites on Cyanobacterium genomeby
using hidden Markov model. DNARes.
Yada
357

