Proceedings of the Twenty-Third AAAI Conference on Artificial Intelligence (2008)
A User-Oriented Webpage Ranking Algorithm Based on User Attention Time
Songhua Xu†,‡,§∗ , Yi Zhu§ , Hao Jiang§ and Francis C.M. Lau§
† College of Computer Science and Technology, Zhejiang University, Hangzhou, Zhejiang, P.R. China, 310027
‡ Department of Computer Science, Yale University, New Haven, Connecticut, USA, 06520-8285
§ Department of Computer Science, The University of Hong Kong, Hong Kong, P.R. China
Abstract
1. Submit a search query by typing in a few keywords.
We propose a new webpage ranking algorithm which is personalized. Our idea is to rely on the attention time spent on a
document by the user as the essential clue for producing the
user-oriented webpage ranking. The prediction of the attention time of a new webpage is based on the attention time of
other previously browsed pages by this user. To acquire the
attention time of the latter webpages, we developed a browser
plugin which is able to record the time a user spends reading
a certain webpage and then automatically send that data to a
server. Once the user attention time is acquired, we calibrate
it to account for potential repetitive occurrences of the webpage before using it in the prediction process. After the user’s
attention times of a collection of documents are known, our
algorithm can predict the user’s attention time of a new document through document content similarity analysis, which is
applied to both texts and images. We evaluate the webpage
ranking results from our algorithm by comparing them with
the ones produced by Google’s Pagerank algorithm.
2. Wait until the webpage rank list is returned by the
search engine.
3. Scan the title and/or summary of each document,
which is usually provided in the returned search result
page.
4. Click on the links to the documents that the user is interested in, which might be several.
5. Wait until the desired page(s) are loaded.
6. Browse/read the loaded page(s).
7. After looking through all the opened pages, the user
may click on more links in the webpage rank list to
request more webpages or submit a new query using
other keywords if the initial search results do not serve
his search interest well.
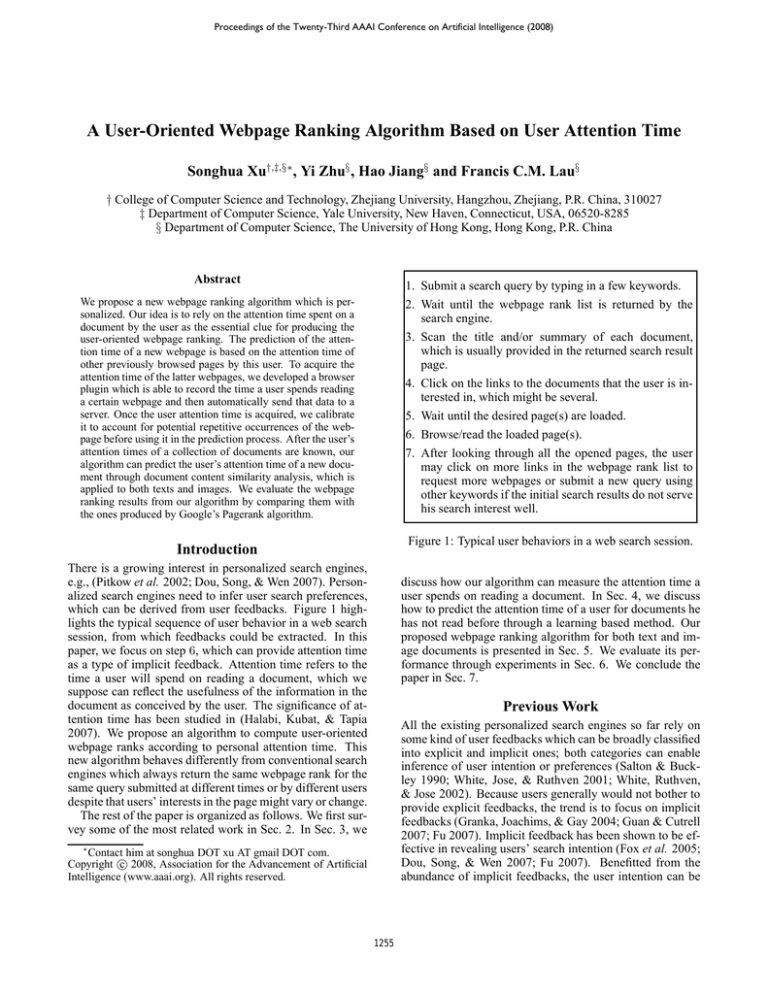
Figure 1: Typical user behaviors in a web search session.
Introduction
There is a growing interest in personalized search engines,
e.g., (Pitkow et al. 2002; Dou, Song, & Wen 2007). Personalized search engines need to infer user search preferences,
which can be derived from user feedbacks. Figure 1 highlights the typical sequence of user behavior in a web search
session, from which feedbacks could be extracted. In this
paper, we focus on step 6, which can provide attention time
as a type of implicit feedback. Attention time refers to the
time a user will spend on reading a document, which we
suppose can reflect the usefulness of the information in the
document as conceived by the user. The significance of attention time has been studied in (Halabi, Kubat, & Tapia
2007). We propose an algorithm to compute user-oriented
webpage ranks according to personal attention time. This
new algorithm behaves differently from conventional search
engines which always return the same webpage rank for the
same query submitted at different times or by different users
despite that users’ interests in the page might vary or change.
The rest of the paper is organized as follows. We first survey some of the most related work in Sec. 2. In Sec. 3, we
discuss how our algorithm can measure the attention time a
user spends on reading a document. In Sec. 4, we discuss
how to predict the attention time of a user for documents he
has not read before through a learning based method. Our
proposed webpage ranking algorithm for both text and image documents is presented in Sec. 5. We evaluate its performance through experiments in Sec. 6. We conclude the
paper in Sec. 7.
Previous Work
All the existing personalized search engines so far rely on
some kind of user feedbacks which can be broadly classified
into explicit and implicit ones; both categories can enable
inference of user intention or preferences (Salton & Buckley 1990; White, Jose, & Ruthven 2001; White, Ruthven,
& Jose 2002). Because users generally would not bother to
provide explicit feedbacks, the trend is to focus on implicit
feedbacks (Granka, Joachims, & Gay 2004; Guan & Cutrell
2007; Fu 2007). Implicit feedback has been shown to be effective in revealing users’ search intention (Fox et al. 2005;
Dou, Song, & Wen 2007; Fu 2007). Benefitted from the
abundance of implicit feedbacks, the user intention can be
∗
Contact him at songhua DOT xu AT gmail DOT com.
c 2008, Association for the Advancement of Artificial
Copyright Intelligence (www.aaai.org). All rights reserved.
1255
Obtaining attention time through a customized
browser
more reliably inferred than through approaches based on explicit feedbacks.
Query history Query history probably is currently the most widely used implicit user feedback,
which has been adopted by Google among others
(http://www.google.com/psearch).
In general, there
exist two classes of methods for personalized search based
on query history: those based on the whole query history
of a user and those based on query history in a particular
search session. For the former, usually a user profile is
generated to describe the user’s search preference.
Click data Click data is another type of implicit user
feedback, e.g., (Dupret, Murdock, & Piwowarski 2007;
Joachims 2002). The assumption is that when a user clicks
on a document, the document is considered to be of more
interest to the user than the other unclicked ones. There are
many ways to infer user preferences from click behaviors.
For example, people have applied the ranking SVM algorithm (Hersh et al. 1994) to find the best webpage rank according to a user click dataset (Joachims et al. 2005). In
(Radlinski & Joachims 2005), both cross-query preference
and individual-query preference are extracted for training a
webpage rank model through a ranking SVM algorithm. Sun
et al. (2005) proposed a method based on singular value decomposition to improve the accuracy of a recommendation
system through analyzing user click data.
Attention time Attention time, also referred to as display
time or reading time, is a relatively new type of implicit
user feedbacks which is gaining increasing popularity, but
whose usefulness is still a debate. Kelly and Belkin (2004;
2001) suggest that there is no reliable relationship between
the interestingness of documents and their display time; in
their study the display time is measured as the average reading time of a group of users on articles retrieved in search
activities across different topics. On the other hand, Halabi
et al. (2007) contended that for a fixed user in a certain query
session, attention time gives a strong indication of the user’s
interest. We think these opinions are not contradicting as
display time is computed differently by the two groups. In
this paper, we assume that user specific or topic specific attention time does serve as an indicator of the user’s interest.
Our customized web browser is implemented as a Firefox
extension. Basically, there are two types of webpages. One
is the initial search result page returned after a user query is
submitted to a search engine, which usually contains a set
of links and a summary for text document or thumbnails for
image; this corresponds to step 3 of Figure 1. The other
type is the text document or image itself after the user has
requested to load it; this corresponds to step 6 of Figure 1.
For the initial search result pages, the customized browser
measures the attention time a user spends on a certain document or image, which is the duration of his mouse or tablet
pen situating above the link, the text summary or the thumbnail image.
For the loaded webpage containing the actual image or
text content, the customized browser records the duration
the document is actively displayed to the user. For instance,
at time t0 the user opens or switches to the document and
at time t1 the document loses focus, e.g., being occluded
by another document in front of it, or is closed. Given the
two time stamps, the browser calculates the attention time
of the user on the document as t1 − t0 . If later on the user
goes back to a previously read document, that document’s
attention time will accumulate.
To increase the accuracy of the attention time, we introduce a truncation threshold, tmax , to represent the maximum
reading time for a document of a certain length. If the accumulated attention time exceeds tmax , it means the user is
likely in a thinking mode. Experimentally, we find setting
this threshold helps improve the reliability of our predicted
attention times noticeably. We argue that when the reading
time over a document is significantly longer than a certain
reasonable value, it is the ideas that emerge from the reading
process that consume most of the user’s mental processing
time, rather than the information contained in the document.
To set tmax for a document, we make use of training data of
available user attention time samples. The step amounts to
pruning away outliers in the training set.
Prediction of Attention Time
The attention time prediction algorithm
Acquisition of Attention Time Samples
Our attention time prediction is based on the content similarity of two documents. We assume if the contents of
two documents are sufficiently similar, then a user shall
have more or less the same amount of interest towards either of them. We use Sim(d0 , d1 ) to denote the content
similarity between document d0 and document d1 , where
Sim(d0 , d1 ) ∈ [0, 1]. A good estimation of Sim(d0 , d1 )
plays a critical role in our attention time prediction algorithm.
We denote the training sample set as {tatt (u, di )|i =
1, · · · , n} where n is the number of documents u has read
so far, which are represented as di (i = 1, · · · , n). When
a new document dx arrives, we calculate the similarity between dx and all the documents in the training set. We then
select k documents which have the highest similarity with
dx . In our current experiment, k is set as min(10, n), where
At present, no existing browser or the systems they operate on provide the attention time of a certain user for a
certain document. Therefore, we developed a customized
web browser to allow us to capture this type of information.
We deal with both images and text documents. For texts,
a search engine would usually provide a few lines of summary of the document in the returned query result page. The
attention time over a text document is then the time that a
user spends on reading the summary of the document plus
the time in reading the actual contents of the document. For
images, a search engine would usually provide a thumbnail
of the image in the returned query result page. Similarly, the
attention time is the time that a user spends on looking at the
thumbnail of the image plus the time on the image itself. For
a document containing both types of elements, its attention
time is the sum of both parts of time.
1256
n is the size of the current training sample set. Without loss
of generality and for ease of notation, we assume they are
the documents di (i = 1, · · · , k). Then we use the following
equation to predict the attention time for dx :
Pk
γ
i=1 tatt (u, di )Sim (di , dx )δ(di , dx )
, (1)
tatt (u, dx ) =
Pk
γ
i=1 Sim (di , dx )δ(di , dx ) + ǫ
where γ is a weight controlling how the values of Sim(, )
will contribute to the estimation of attention time, and ǫ is a
small positive number to avoid the divide-by-zero error. The
function of δ(, ) filters out the effects of those documents
whose similarity is below a certain threshold, which is defined as:
1 If Simγ (di , dx ) > 0.01
δ(di , dx ) =
.
(2)
0 Otherwise
web search interface, which consists of a client side for acquiring the attention time records of individual users on individual documents and a server side for producing the useroriented webpage ranks based on the prediction of attention
times of users on documents they have not yet read.
Client side
On the client side, the acquisition method mentioned in
Sec. 3 is implemented. The client side periodically sends the
measured attention time records to the sever side as well as
user identification numbers which are needed in our personalized webpage ranking estimation, to be discussed shortly.
Server side
The server side implements a search engine in Java. When
the server side application receives a search query submitted
by a certain user, the application would forward the query
to Google first and download the first 300 records if they
have not been previously downloaded to our server. Then
our search engine predicts the attention time of the user over
each such record through (1), if the attention time of the user
over a record is unknown previously. To take advantage of
the link analysis results of the Google Pagerank algorithm,
we use the following equation to compute a normalized attention time offset, whose range is between 0 and 1:
2 exp − κd · rank(i)
of f set
,
tatten (i) =
(3)
1 + exp − κd · rank(i)
Estimating text and image similarities
Before we compute the similarity of two text documents, we
first carry out some preprocessing because documents we
download from the internet usually contain lots of superfluous information, e.g., tags, advertisements and website navigation bars and links. In our current implementation, we
simply remove the HTML tags. We intend to extend and
strengthen this component to be able to automatically detect
and remove advertisements and other additionally appended
information in the future.
There exist many algorithms for estimating pairwise text
similarity. A summary can be found in the webpage
http://www.dcs.shef.ac.uk/%7Esam/stringmetrics.html. In
our work, we utilize the “simpack” open source package
(Bernstein et al. 2005; Ziegler et al. 2006) accessible from
http://www.ifi.unizh.ch/ddis/simpack.html, which provides
implementations of five text similarity algorithms. Each
of the five algorithms can serve as a definition for Sim(, )
used in (1). Empirically, we found that the extended Jaccard method, namely the Tanimoto method, for text similarity estimation (Strehl & Ghosh 2000) works the best in our
experiment setting.
For the image content similarity measurement, experimentally we find the content similarity measurement based on the feature of “Auto Color Correlogram”
(Huang et al. 1997) to be most reliable for our experiments.
We adopt the implementation offered by
the open source content based image retrieval library
(http://www.semanticmetadata.net/lire/) in our experiment.
In the future, we plan to investigate and employ algorithms that work for both text and image elements in measuring document similarity, e.g., Zhou and Dai’s context similarity algorithm (2007).
where rank(i) denotes Google’s webpage rank for document i in the 300 webpages. We choose such a function because it tentatively converts a webpage rank into a list of attention time records where documents ranking low in the list
are expected to receive significantly shorter attention time.
The parameter κd controls how sharp this dropoff is, whose
typical value in our experiment is set as 0.2. Once the atf set
tention time tatten (i) and attention offset time tof
atten (i) are
known for the document i, we can simply derive the overall attention time for i as: toverall
atten (i) = κoverall tatten (i) +
f set
tof
(i).
The
parameter
κ
overall is a user tunable value
atten
moderating how much he would prefer the user oriented
rank result to preserve the rank produced by Google. Finally, our user-oriented webpage rank is produced by ranking all the documents according to their respective overall
attention time in a descending order. Note that we have also
implemented an automatic mechanism which sets κoverall to
a low value when there are few samples in the attention time
training set and gradually increases the value of κoverall as
the number of attention time training samples increases. The
rationale behind is because our user-oriented webpage rank
algorithm is essentially a learning based method. However,
initially when the training set is small, like all the learning
based algorithms, our algorithm tends to produce inferior
results. Thus we need to “borrow” Google’s webpage rank
results while there is little to be learned from at the beginning. In our current experiment we use the Sigmoid function
to automatically vary the value of κoverall with the input of
the function being the number of documents in the training
set times a constant which is typically set to be 0.1.
User-oriented Webpage Ranking based on
User Attention Time
Now we can suggest a user-oriented webpage ranking algorithm based on user attention time acquisition and prediction. To test the algorithm, we have developed a prototype
1257
Rkuser
6
9
1
17
2
15
16
5
11
10
14
12
3
13
8
7
4
0
Figure 2: Experiment results for all fifteen text search experiments. The x-axis indicates the webpage ranks analyzed here, i.e., the rank produced by Google’s algorithm,
RkGoogle , the webpage ranks produced by our algorithm after the user has read 2, 5, 8, 10, 15 webpages, Rk2 , Rk5 ,
Rk8 , Rk10 , Rk15 , as well as the webpage rank expected
by the user, Rkuser . The y-axis plots the sum of the absolute differences of a certain webpage rank with respect to
Rkuser . The raw data are reported in Tables 1 and 2.
RkGoogle
1
4
2
3
6
5
7
8
15
14
18
16
4
11
6
5
7
96
Rk2
1
17
2
10
3
12
13
9
13
15
16
12
4
9
5
14
8
60
Rk5
15
16
1
17
7
9
14
4
6
13
12
11
4
10
3
8
5
52
Rk8
13
14
1
16
2
15
17
12
6
11
9
10
3
8
4
7
5
44
Rk10
11
12
1
16
2
15
17
10
14
13
7
9
3
8
4
6
5
42
Rk15
7
9
1
16
2
15
17
6
11
10
14
12
3
13
8
5
4
6
Table 1: Text search experiment using “Web search technology” as the query keywords. The columns from left to
right correspond respectively to the ideal webpage rank list
provided by the user, the Google page rank list, and the webpage rank list produced by our algorithm after the user has
read 2, 5, 8, 10, 15 webpages. The last row reports the error of the respective webpage ranks w.r.t. the user supplied
ground-truth webpage ranks.
Experiment Results
Text search
Here we report the results of fifteen text search experiments.
In each experiment, we use our customized Firefox browser
to acquire user attention time during the browsing process.
The user is asked to read the first 20 documents returned
from Google on the respective search queries. After that, he
is asked to provide a webpage rank list which reflects his
search interests, i.e., his expected ideal personal webpage
ranks. We then use our user-oriented webpage rank algorithm to generate the webpage ranks with the attention time
data after he has read 2, 5, 8, 10 and 15 documents respectively. We denote the webpage ranks produced by our algorithm after the user has read i documents as Rki , namely the
personal webpage rank list after our algorithm has access to
attention time data of the user on i documents. We compare
both Google page ranks and the webpage ranks produced by
our algorithm with respect to the user supplied ground-truth
webpage ranks. We use the sum of the absolute differences
of each page’s rank against its rank in the ground truth as
the error measurement. Table 1 shows a set of statistics from
one of the experiments in which the search keyword phrase
is “web search technology”. Table 2 summarizes the statistics for the other fourteen text search experiments. These
statistics are also plotted in Figure 2.
Search keyword RkGoogle Rk2 Rk5 Rk8 Rk10 Rk15
greenhouse effect
88
66 66 62 52 16
Gnome Linux
86
64 60 56 50 18
encryption algorithm 123
99 78 65 45 22
RISC
94
82 62 58 50 32
advertising ethics
94
77 62 47 41 10
da Vinci
103
99 65 49 39 21
olympic
77
72 58 50 36 10
anckor
90
94 92 74 46 16
color management
128 146 94 90 66 52
NBA
109
94 76 62 36 22
correlation
122 114 114 88 82 54
houston
133
98 92 85 76 43
investment
132 120 104 100 94 46
samsung
71
74 68 42 36
4
Table 2: Fourteen more text search experiments, conducted
by fourteen different users under the same setting as that for
Table 1. Due to space limit, we only report errors of each
webpage rank w.r.t. the user provided ground-truth webpage
rank, i.e., the one corresponding to the last row of Table 1.
Notice that it is the user who conducts the web search experiment that provides his most desired webpage rank at the
end of the respective experiment. These statistics are also
plotted in Figure 2.
Image search
The image search experiments are conducted in a similar
setting to the above text search experiments except this time
users are asked to look through the first four pages of image
1258
RkGoogle
9
16
17
23
41
48
25.67
Rk1st
1
63
3
41
24
13
24.17
Rk2nd
1
3
2
15
37
4
10.33
Rk3rd
1
5
3
2
4
6
3.5
Table 3: Result of an image search experiment. Here the
user enters the query keyword “Picasso”; but he is actually looking for self-portrait by Picasso. Among 60 images
searched, only 6 appears relevant to the user’s search objective. Each column reports the ranks of the images by
Google and by our algorithm after the user has seen the first,
the first two and the first three pages of images, denoted as
Rk1st , Rk2nd and Rk3rd respectively. We also denote the
Google image search result as RkGoogle here. The last row
reports the average rank held by these images. Apparently,
the smaller the rank value, the earlier images of interest to
the user would appear in the image search result set.
Figure 3: Results of the seven image search experiments reported in Tables 3 and 4. Each experiment is conducted by a
different user under the same setting as that for Table 3. We
plot here the average rank held by the images that the user
intends to look for. The smaller the average value, the earlier these user interested images would appear in the image
search result page.
Search Keyword # Images RkGoogle
tree
9
16.22
desert
10
20.2
South Pole
14
24.57
Apple
9
21.33
break heart
5
22.4
Pirates of
19
24.37
the Caribbean
search results returned by Google, i.e., the top sixty image
search results. After the user has browsed the first, the first
two, and the first three pages of image results, our algorithm
produces the user-oriented ranks for these images. We also
ask the users to identify the images relevant to their search
interest after the completion of the respective image search
experiments. This image information is used as ground-truth
data to tell how well the Google page ranks and the ranks
produced by our algorithm approach the ideal ranks. Statistics of one sample experiment where a user searches for images with the keyword “Picasso” are shown in Table 3. Table 4 reports six more image search experiments by six different users. These statistics are visualized in Figure 3. In
all these experiments, we rely on the FireFox extension we
developed to acquire the user attention time.
In conclusion, by the experiments presented above, we
have verified that our user-oriented webpage rank algorithm
can indeed produce webpage ranks that are more reflective
of the user’s interest. We expect the user can enjoy a significant saving of searching time if he would employ our proposed webpage rank algorithm and its computing method.
Our conclusion comes from using Google’s algorithm as the
benchmark comparison target. We do not exclude the possibility that some research algorithm might surpass Google’s.
But we are optimistic that if our algorithm would demonstrate certain advantages over Google’s in providing personalized search engine service, then our algorithm should appeal to the research community and perhaps also the industry. Lastly, the number of attention time samples available to
our algorithm has a major impact on the algorithm’s performance. With more attention time samples being available,
our algorithm can produce a webpage ranking that closely
approximates the reading interest of a user.
Rk1st
10.56
15.4
23.5
12.33
22
27.16
Rk2nd
8.11
14.1
21.21
11.78
21.2
20.37
Rk3rd
6
12.6
13.71
11.22
8.2
15.32
Table 4: Results of six more image search experiments.
Each experiment is conducted by a different user under the
same setting as that for Table 3. That is, the user is asked
to look for images relevant to his search objective among a
total of sixty images. The first column lists the respective
search keywords and the second column reports the number
of images of interest to the user, as identified by the user at
the end of the experiment. We only list the average rank of
all these images here, i.e., those corresponding to the last
row of Table 3.
Conclusion and Discussion
In this paper, we propose a new user-oriented webpage ranking algorithm based on individual users’ attention times.
The design and implementation of the algorithm are based
on a set of intelligent algorithms, including semantics-based
text similarity measurement, content-based image similarity measurement, and text and image clustering algorithms.
Due to the page limit, we are only able to report a subset of
the experiment results we have obtained. Nevertheless, these
reported statistics clearly show that our new algorithm can
satisfactorily produce a new user-oriented webpage ranking
which is in better agreement with the user’s expectation and
reading interest and preference than previous methods, as
verified by the comparison against the benchmark algorithm
by Google.
1259
Acknowledgements
Joachims, T. 2002. Optimizing search engines using
clickthrough data. In KDD ’02: Proc. of the 8th ACM
SIGKDD International Conference on Knowledge Discovery and Data Mining, 133–142. New York, NY, USA:
ACM.
Kelly, D., and Belkin, N. J. 2001. Reading time, scrolling
and interaction: exploring implicit sources of user preferences for relevance feedback. In SIGIR ’01: Proc. of
the 24th Annual International ACM SIGIR Conference on
Research and Development in Information Retrieval, 408–
409. New York, NY, USA: ACM.
Kelly, D., and Belkin, N. J. 2004. Display time as implicit feedback: understanding task effects. In SIGIR ’04:
Proc. of the 27th Annual International ACM SIGIR Conference on Research and Development in Information Retrieval, 377–384. New York, NY, USA: ACM.
Pitkow, J.; Schütze, H.; Cass, T.; Cooley, R.; Turnbull, D.;
Edmonds, A.; Adar, E.; and Breuel, T. 2002. Personalized
search. Communications of the ACM 45(9):50–55.
Radlinski, F., and Joachims, T. 2005. Query chains: learning to rank from implicit feedback. In KDD ’05: Proc.
of the 11th ACM SIGKDD International Conference on
Knowledge Discovery in Data Mining, 239–248. New
York, NY, USA: ACM.
Salton, G., and Buckley, C. 1990. Improving retrieval performance by relevance feedback. Jornal of the American
Society for Information Science 41(4):288–297.
Strehl, A., and Ghosh, J. 2000. Value-based customer
grouping from large retail data-sets. In Proc. of the SPIE
Conference on Data Mining and Knowledge Discovery:
Theory, Tools, and Technology II, volume 4057, 33–42.
Sun, J.-T.; Zeng, H.-J.; Liu, H.; Lu, Y.; and Chen, Z. 2005.
Cubesvd: a novel approach to personalized web search. In
WWW ’05: Proc. of the 14th International Conference on
World Wide Web, 382–390. New York, NY, USA: ACM.
White, R.; Jose, J. M.; and Ruthven, I. 2001. Comparing
explicit and implicit feedback techniques for web retrieval:
Trec-10 interactive track report. In TREC 2001: Proc. of
the 10th Text Retrieval Conference. National Institute of
Standards and Technology.
White, R.; Ruthven, I.; and Jose, J. M. 2002. The use of
implicit evidence for relevance feedback in web retrieval.
In Proc. of the 24th BCS-IRSG European Colloquium on
IR Research, 93–109. London, UK: Springer-Verlag.
Zhou, Z.-H., and Dai, H.-B. 2007. Exploiting image contents in web search. In IJCAI ’07: Proc. of the 20th International Joint Conference on Artificial Intelligence, 2922–
2927.
Ziegler, P.; Kiefer, C.; Sturm, C.; Dittrich, K. R.; and
Bernstein, A. 2006. Generic similarity detection in ontologies with the soqa-simpack toolkit. In SIGMOD ’06:
Proc. of the 2006 ACM SIGMOD International Conference
on Management of Data, 751–753. New York, NY, USA:
ACM.
We would like to thank Wenxia Yang (Michelle) for helping us in some of the experiments. This work has a patent
pending.
References
Bernstein, A.; Kaufmann, E.; Kiefer, C.; and Bürki, C.
2005. SimPack: A Generic Java Library for Similiarity
Measures in Ontologies. Technical Report, Department of
Informatics, University of Zurich.
Dou, Z.; Song, R.; and Wen, J.-R. 2007. A large-scale
evaluation and analysis of personalized search strategies.
In WWW ’07: Proc. of the 16th International Conference
on World Wide Web, 581–590. New York, NY, USA: ACM.
Dupret, G.; Murdock, V.; and Piwowarski, B. 2007. Web
search engine evaluation using clickthrough data and a user
model. In WWW ’07: Proc. of the 16th International Conference on World Wide Web.
Fox, S.; Karnawat, K.; Mydland, M.; Dumais, S.; and
White, T. 2005. Evaluating implicit measures to improve
web search. ACM Transactions on Information Systems
23(2):147–168.
Fu, X. 2007. Evaluating sources of implicit feedback in
web searches. In RecSys ’07: Proc. of the 2007 ACM Conference on Recommender Systems, 191–194. New York,
NY, USA: ACM.
Granka, L. A.; Joachims, T.; and Gay, G. 2004. Eyetracking analysis of user behavior in www search. In SIGIR
’04: Proc. of the 27th Annual International ACM SIGIR
Conference on Research and Development in Information
Retrieval, 478–479. New York, NY, USA: ACM.
Guan, Z., and Cutrell, E. 2007. An eye tracking study of
the effect of target rank on web search. In CHI ’07: Proc. of
the SIGCHI Conference on Human Factors in Computing
Systems, 417–420. New York, NY, USA: ACM.
Halabi, W. S. A.; Kubat, M.; and Tapia, M. 2007. Time
spent on a web page is sufficient to infer a user’s interest.
In IMSA ’07: Proc. of the IASTED European Conference,
41–46. Anaheim, CA, USA: ACTA Press.
Hersh, W.; Buckley, C.; Leone, T. J.; and Hickam, D. 1994.
Ohsumed: an interactive retrieval evaluation and new large
test collection for research. In SIGIR ’94: Proc. of the 17th
Annual International ACM SIGIR Conference on Research
and Development in Information Retrieval, 192–201. New
York, NY, USA: Springer-Verlag New York, Inc.
Huang, J.; Kumar, S. R.; Mitra, M.; Zhu, W.-J.; and Zabih,
R. 1997. Image indexing using color correlograms. In
CVPR ’97: Proc. of the 1997 Conference on Computer Vision and Pattern Recognition, 762–768. Washington, DC,
USA: IEEE Computer Society.
Joachims, T.; Granka, L.; Pan, B.; Hembrooke, H.; and
Gay, G. 2005. Accurately interpreting clickthrough data as
implicit feedback. In SIGIR ’05: Proc. of the 28th Annual
International ACM SIGIR Conference on Research and Development in Information Retrieval, 154–161. New York,
NY, USA: ACM.
1260

