Dynamic Regime Identification and Prediction Based on
Observed Behavior in Electronic Marketplaces
Wolfgang Ketter
Department of Computer Science and Engineering
University of Minnesota
ketter@cs.umn.edu
Abstract
We present a method for an autonomous agent to identify
dominant market conditions, such as oversupply or scarcity.
The characteristics of economic regimes are learned from historic data and used, together with real-time observable information, to identify the current market regime and to forecast
market changes. The approach is validated with data from the
Trading Agent Competition for Supply Chain Management.
Introduction and Problem Definition
The Supply-Chain Management Trading Agent Competition (Sadeh et al. 2003) (TAC SCM) involves a Supply
Chain Management scenario in which in each round six autonomous agents attempt to maximize profit by selling personal computers they assemble from parts they buy from
suppliers. The agent with the highest bank balance at the
end of the game wins. An agent has to make many decisions,
such as how many parts to buy, when to get them delivered,
what types of computers to build, when to sell them, and at
what price. Availability of parts and demand for computers
varies randomly through the game and across market segments (low, medium, and high computer price). The market
is affected not only by variations in supply and demand, but
also by the actions of other agents. The small number of
agents and their ability to adapt to and manipulate the market makes the game highly dynamic and uncertain.
Marketing research methods have been developed for improving sales by understanding the relationships between
market conditions and actions. For instance, in (Pauwels
& Hanssens 2002), an analysis is presented on how in mature economics markets strategic windows of change alternate with long periods of stability. Sales strategies used in
previous TAC SCM competitions model the probability of
receiving an order for a given offer price, either by estimating the probability by linear interpolation from the minimum
and maximum daily price records (Pardoe & Stone 2004),
or by estimating the relationship between offer price and
order probability with a linear cumulative density function
(CDF) (Benisch et al. 2004), or by using a reverse CDF and
factors such as quantity and due date (Ketter et al. 2004).
Copyright c 2005, American Association for Artificial Intelligence (www.aaai.org). All rights reserved.
All these methods have the disadvantage that they do not
explicitly take market conditions into account.
The approach we present here is motivated by the longstanding realization among economists that market conditions play a critical role in making operational and strategic
decisions for raw material acquisition, production, and sales.
Regime Identification
Mathematically, we define a regime with the help of a Gaussian mixture model (GMM). First we collect order prices
from past games (in our experiments we use the semi-finals
and finals of TAC SCM 2004). Each computer type has a
different nominal price, which is simply the sum of the nominal cost of each component part. We use normalized prices
(np) and we apply the Expectation Maximization algorithm
to determine the components (µi ,σi , and prior probability)
of the GMM. The GMM has the following form:
p(np) =
N
X
p(np|ci ) × P (ci )
i=1
where p(np|ci ) = N [µi , σi ](np) is the i-th component of
the normalized price density from the GMM, and P (ci ) is
the prior probability of the i-th component. An example is
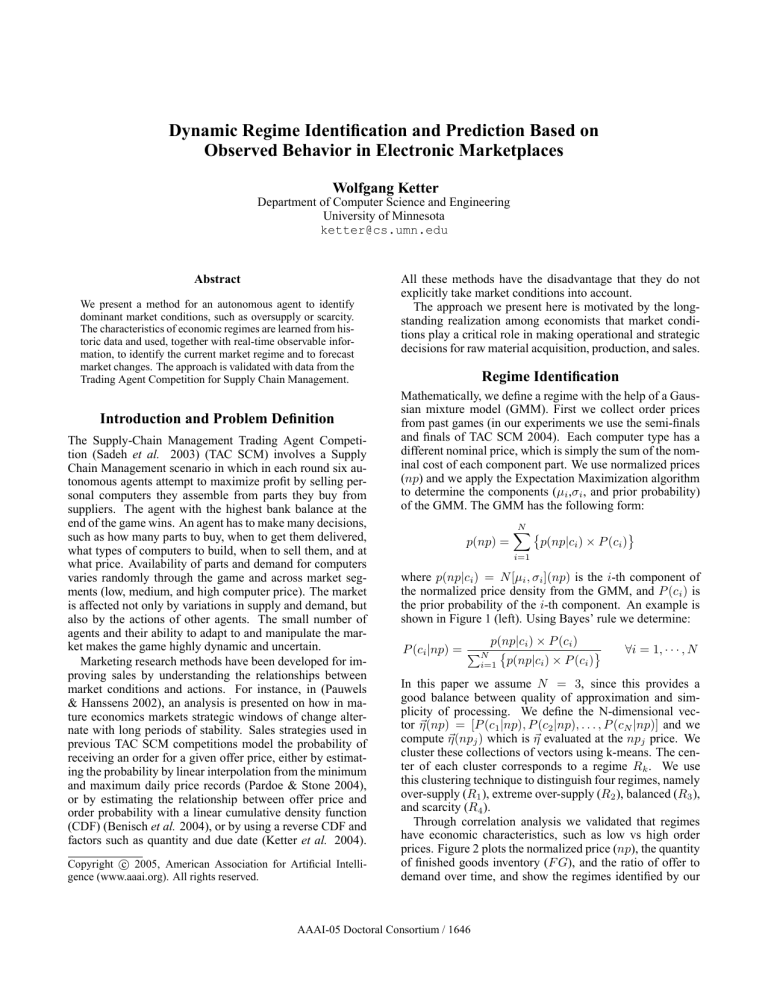
shown in Figure 1 (left). Using Bayes’ rule we determine:
p(np|ci ) × P (ci )
P (ci |np) = PN i=1 p(np|ci ) × P (ci )
∀i = 1, · · · , N
In this paper we assume N = 3, since this provides a
good balance between quality of approximation and simplicity of processing. We define the N-dimensional vector ~η (np) = [P (c1 |np), P (c2 |np), . . . , P (cN |np)] and we
compute ~η (npj ) which is ~η evaluated at the npj price. We
cluster these collections of vectors using k-means. The center of each cluster corresponds to a regime Rk . We use
this clustering technique to distinguish four regimes, namely
over-supply (R1 ), extreme over-supply (R2 ), balanced (R3 ),
and scarcity (R4 ).
Through correlation analysis we validated that regimes
have economic characteristics, such as low vs high order
prices. Figure 2 plots the normalized price (np), the quantity
of finished goods inventory (F G), and the ratio of offer to
demand over time, and show the regimes identified by our
AAAI-05 Doctoral Consortium / 1646
regimes − online − high market segment − 1189tac4
3
1.5
GMM
5
1
0.5
0
0
0.2
0.4
0.6
0.8
Normalized Price
1
1.2
Regimes
Product Quantity
P(np|c1)*P(c1)
P(np|c2)*P(c2)
P(np|c3)*P(c3)
Ratio Highest 2 Regimes Probabilities
Product Quantity
5
2
Gaussian Mixture Model
10
Regime Confidence Measure − high − 1189tac4
4
4
x 10 Gaussian Mixture Model − high − SemifinalFinalTAC04
2
1
0
0
0
20
40
60
80
100 120 140 160 180 200 220
Time in Days
4.5
4
3.5
3
2.5
2
1.5
1
0
50
100
Days
150
200
Figure 1: Gaussian mixture model computed from 30 games (left), regimes over time (middle) and ratio of probabilities of best
and second best regime (right) computed online every day for the high market segment in game 1189@tac4.
high market segment − 1189tac4
Offer
Demand ≈ 5
o FG
1
10000
Normalized Price (np)
Finished Goods Inventory (FG)
np
Regime
Change
Ratio Offer/Demand
0
0
R
R4
R1
3
50
R3
100
Days
R
4
Offer
Demand ≈ 1
R3
150
200
0
Figure 2: Game 1189@tac4 (Final TAC SCM 04) – Relationships between dominant regimes and ratio of offer to demand, normalized price, and available finished goods inventory in the high market segment over time.
Offer
approach. Between day 181 and 184 the ratio Demand
was
high (between 4.5 and 4.9), but the balanced regime R3 remained the active regime in that period. We observe that the
Offer
ratio Demand
is only one of the parameters in characterizing
the multi-dimensional regime parameter space.
We can rewrite p(np|ci ) in a form that shows the dependence of the normalized price np not on the component ci
of the GMM, but on the regime Rk :
P (np|Rk ) =
N
X
p(np|ci ) × P (ci |Rk )
i=1
Using Bayes’ rule again we compute
P (np|Rk ) × P (Rk )
P (Rk |np) = PR
k=1 P (np|Rk ) × P (Rk )
∀k = 1, · · · , R
The prior probabilities P (Rk ) of the regimes are determined
by a counting process over multiple games. During the game
the agent estimates every day the current regime by calculating the mean normalized price npday for the day and by
selecting the regime which has the highest probability, i.e.
max(P~ (R|npday )). An example is in Figure 1 (middle).
A simple method for predicting regime changes during
the game uses the ratio of the probability of the highest vs
the second highest regime. A high ratio corresponds to high
confidence in regime determination, while a ratio close to
one indicates that the current market situation is a mixture of
almost equally likely regimes. An example is shown in Figure 1 (right). These ratios are collected over an interval of
days in the immediate past and a regime shift is predicted by
interpolation. We are currently developing a more sophisticated semi-Markov model for prediction of regime changes.
Conclusions and Future Work
We believe that our proposed formulation will allow the
agent to do strategic pricing and market manipulation. Our
next steps are to refine the method for predicting regime
changes, design sales strategies that take advantage of
regime prediction, and integrate them in the decision making
process of the agent.
References
Benisch, M.; Greenwald, A.; Grypari, I.; Lederman, R.;
Naroditskiy, V.; and Tschantz, M. 2004. Botticelli: A supply chain management agent designed to optimize under
uncertainty. ACM Trans. on Computat. Logic 4(3):29–37.
Ketter, W.; Kryzhnyaya, E.; Damer, S.; McMillen, C.;
Agovic, A.; Collins, J.; and Gini, M. 2004. MinneTAC
sales strategies for supply chain TAC. In Proc. of the Third
Int’l Conf. on Autonomous Agents and Multi-Agent Systems, 1372–1373.
Pardoe, D., and Stone, P. 2004. Bidding for Customer
Orders in TAC SCM: A Learning Approach. In Workshop
on Trading Agent Design and Analysis at AAMAS, 52–58.
Pauwels, K., and Hanssens, D. 2002. Windows of Change
in Mature Markets. In European Marketing Academy Conf.
Sadeh, N.; Arunachalam, R.; Eriksson, J.; Finne, N.; and
Janson, S. 2003. TAC-03: A supply-chain trading competition. AI Magazine 24(1):92–94.
AAAI-05 Doctoral Consortium / 1647

