From: AAAI-98 Proceedings. Copyright © 1998, AAAI (www.aaai.org). All rights reserved.
Nested Joint Probability Model for Morphological Analysis
and its Grid Pruning
Koji FUJIMOTO, Nobuo INUI and Yoshiyuki KOTANI
Tokyo University of Agriculture and Technology, Department of Computer Science
2-24-16 Nakamachi, Koganei-city, Tokyo 184, Japan
{kfujim,nobu,kotani}@cc.tuat.ac.jp
Abstract
In recent work on morphological analysis based on statistical
models, the conditional probability of the observed i-th word wi
with the i-th tag ti after the (i-1)-th tag ti-1 is defined as the
product of observation symbol probability and the state transition
probability (i.e. P(wi | ti)•P(ti | ti-1) ). In order to improve
accuracy, we face the following problems: 1) if we build hidden
state levels using stricter categories (e.g. lowest POS class, over
3-gram, or word themselves), the state transition probability
matrix becomes much bigger and more sparse; 2) if we use rough
categories, the reliability of statistical information becomes
lower in some parts of speech; and 3) the best state level is not
the same among POS category, and some heuristic knowledge is
necessary to select the best state structure.
This paper presents a novel stochastic model based on a
nested tag class structure (Nested Joint Probability Model)
(Fujimoto,Inui, and Kotani 1998) and its grid puning technique
for data resource saving. This model estimates morpheme
transition probability by frequency lattice which is a direct
product of two nested tag hierarchies. After an important
frequency subset on the lattice is selected by using statistical
test criterion for every pair of morphemes, the most reliable
transition probability is estimated automatically without heuristic
knowledge. Consider a word sequence A B. Class Ai (i=0,1,...m;
A0 means all) is a category in the i-th layer of the previous
morpheme A(=Am) in the word’s hierarchy, and Bj (j=0,1,...n) is
in the j-th layer of the target morpheme B(=Bn). The nested joint
probability model is formulated as a series of joint probabilities,
P(AiBj)={P(AiBj-1)•P(Ai-1Bj)/P(Ai-1Bj-1)} •I(AiBj) (i=0,1,...m;
j=0,1,...n), where I(AiBj) is the conditional interaction effect of
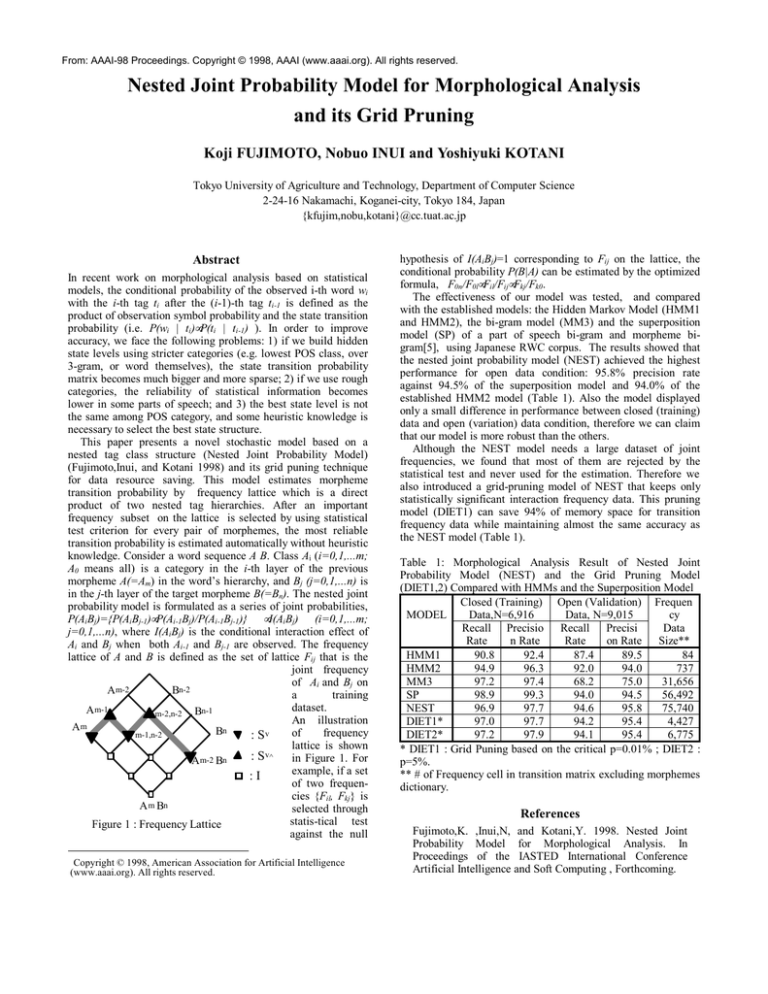
Ai and Bj when both Ai-1 and Bj-1 are observed. The frequency
lattice of A and B is defined as the set of lattice Fij that is the
joint frequency
of Ai and Bj on
A m-2
Bn-2
a
training
dataset.
A m-1
m-2,n-2 Bn-1
An illustration
Am
Bn
of
frequency
m-1,n-2
: Sv
lattice is shown
: Sv^ in Figure 1. For
A m-2 Bn
example, if a set
:I
of two frequencies {Fil, Fkj} is
A m Bn
selected through
statis-tical
test
Figure 1 : Frequency Lattice
against the null
Copyright © 1998, American Association for Artificial Intelligence
(www.aaai.org). All rights reserved.
hypothesis of I(AiBj)=1 corresponding to Fij on the lattice, the
conditional probability P(B|A) can be estimated by the optimized
formula, F0n/F0l•Fil/Fij•Fkj/Fk0.
The effectiveness of our model was tested, and compared
with the established models: the Hidden Markov Model (HMM1
and HMM2), the bi-gram model (MM3) and the superposition
model (SP) of a part of speech bi-gram and morpheme bigram[5], using Japanese RWC corpus. The results showed that
the nested joint probability model (NEST) achieved the highest
performance for open data condition: 95.8% precision rate
against 94.5% of the superposition model and 94.0% of the
established HMM2 model (Table 1). Also the model displayed
only a small difference in performance between closed (training)
data and open (variation) data condition, therefore we can claim
that our model is more robust than the others.
Although the NEST model needs a large dataset of joint
frequencies, we found that most of them are rejected by the
statistical test and never used for the estimation. Therefore we
also introduced a grid-pruning model of NEST that keeps only
statistically significant interaction frequency data. This pruning
model (DIET1) can save 94% of memory space for transition
frequency data while maintaining almost the same accuracy as
the NEST model (Table 1).
Table 1: Morphological Analysis Result of Nested Joint
Probability Model (NEST) and the Grid Pruning Model
(DIET1,2) Compared with HMMs and the Superposition Model
Closed (Training) Open (Validation) Frequen
MODEL
Data,N=6,916
Data, N=9,015
cy
Recall Precisio Recall Precisi
Data
Rate
n Rate
Rate
on Rate Size**
HMM1
90.8
92.4
87.4
89.5
84
HMM2
94.9
96.3
92.0
94.0
737
MM3
97.2
97.4
68.2
75.0
31,656
SP
98.9
99.3
94.0
94.5
56,492
NEST
96.9
97.7
94.6
95.8
75,740
DIET1*
97.0
97.7
94.2
95.4
4,427
DIET2*
97.2
97.9
94.1
95.4
6,775
* DIET1 : Grid Puning based on the critical p=0.01% ; DIET2 :
p=5%.
** # of Frequency cell in transition matrix excluding morphemes
dictionary.
References
Fujimoto,K. ,Inui,N, and Kotani,Y. 1998. Nested Joint
Probability Model for Morphological Analysis. In
Proceedings of the IASTED International Conference
Artificial Intelligence and Soft Computing , Forthcoming.


