From: AAAI-97 Proceedings. Copyright © 1997, AAAI (www.aaai.org). All rights reserved.
Combining
Frank
Approxi
Victor
Klassner
Hamid
Lesser
Nawabt
tECE
Department
Boston
University
Boston,
MA
02215
hamid@bu.edu
Computer
Science
Department
University
of Massachusetts
Amherst,
MA
01003
(klassner
lesser}@cs.umass.edu
depends
upon signal decomposition
by the front end
through
inversion
of the physical processes that led to
the original signal (Draper,
1993).2
Since this design paradigm
emphasizes one pass over
input data, there is a tendency
to build perceptual
systems with fixed front ends that are expensive
because
they must provide
detail for the most ambiguous
interpretation
cases even when that detail is unnecessary. Dorken
(Dorken
et al., 1992) showed that, as
the complexity
of an acoustic
environment
increases
(e.g. greater signal signature
interference,
more signal
sources emitting
simultaneously,
etc.), classic interpretation systems can require
front ends with a combinatorially
explosive number
of fixed SPAS with multiple parameter
settings
to avoid ambiguous
signal-tosymbol mappings,
with consequent
front end processing time costs.
Tsotsos (Tsotsos
1989) also demonstrated this property
in the visual domain,
through
a
proof of the NP-completeness
of the machine-vision
interpretation
problem.
Abstract
When
dealing
with
signals
from
complex
environments,
where
multiple
time-dependent
signal
signatures can interfere
with each other in stochastically
unpredictable
ways,
traditional
perceptual
systems
tend
to fall back on a strategy
of always
performing
finelydetailed,
costly
analysis
of the signal
with
a comprehensive
front
end set of signal
processing
algorithms
(SPAS),
whether
or not the current
scenario
requires
the extra
detail.
Approximate
SPAS (ASPAs)
- algorithms
whose
processing
time
can be limited
in order
to trade
off precision
in their
outputs
for reduced
execution
time - can play
a role in producing
adaptive,
less-costly
front
ends,
but their
outputs
tend
to require
context-dependent
analysis
for use as evidence
in interpretation.
This
paper
examines
the IPUS
(Integrated
Processing
and Understanding
of Signals)
architecture’s
ability
to serve as a support
framework
for
applying
ASPAs
in interpretation
problems.
Specifically,
our work
shows
that
it is feasible
to include
an
approximate
version
of the Short-Time
Fourier
Transform
in an IPUS-based
sound-understanding
testbed.
Introduction
Since the early 1980’s, many perceptual
architectures
have incorporated
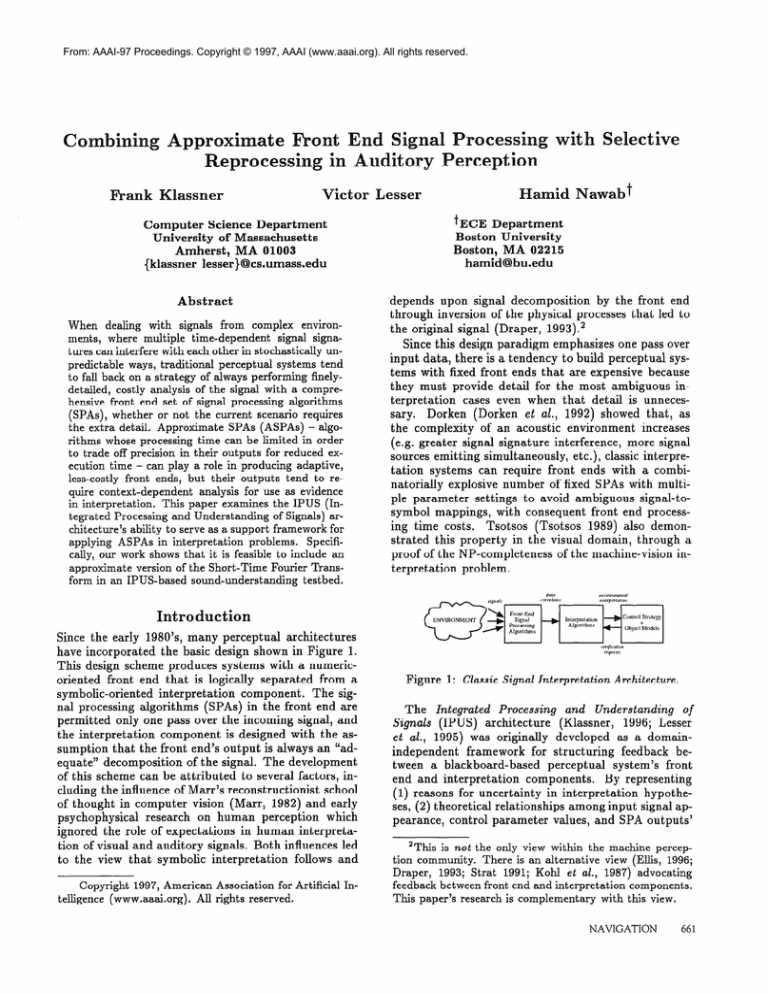
the basic design shown in Figure 1.
This design scheme produces
systems with a numericoriented
front end that is logically
separated
from a
symbolic-oriented
interpretation
component.
The signal processing
algorithms
(SPAS) in the front end are
permitted
only one pass over the incoming
signal, and
the interpretation
component
is designed with the assumption
that the front end’s output is always an “adequate”
decomposition
of the signal. The development
of this scheme can be attributed
to several factors, including the influence
of Marr’s reconstructionist
school
of thought
in computer
vision (Marr,
1982) and early
psychophysical
research
on human
perception
which
ignored the role of expectations
in human interpretation of visual and auditory
signals. Both influences
led
to the view that symbolic
interpretation
follows and
Copyright
1997, American
telligence
(www.aaai.org).
All
Association
for
rights
reserved.
Artificial
In-
Figure
1: Classic
Signal
Interpretation
Architecture.
The Integrated
Processing
and Understanding
of
architecture
(Klassner,
1996; Lesser
Signals
(IPUS)
developed
as a domainet al., 1995) was originally
independent
framework
for structuring
feedback
between a blackboard-based
perceptual
system’s front
end and interpretation
components.
By representing
(1) reasons for uncertainty
in interpretation
hypotheses, (2) theoretical
relationships
among input signal appearance,
control parameter
values, and SPA outputs’
2This
is not the only
view
within
the machine
perception community.
There
is an alternative
view
(Ellis,
1996;
Draper,
1993;
Strat
1991;
Kohl
et al., 1987)
advocating
feedback
between
front
end and interpretation
components.
This
paper’s
research
is complementary
with
this view.
NAVIGATION
661
where SPAS were applied
appearance,
(3) p ossibilities
with parameter
values inappropriate
to the combination of signal objects in the environment,
and (4) the
processing
contexts under which SPA outputs
and interpretations
are created, IPUS implements
perception
as the integration
of search in a front-end-SPA
space
with search in an interpretation
space. Uncertainty
in
one space’s current
state triggers
search in the other
space for an explanation
and resolution
of the ambiguity or discrepancy.
Front-end-SPA
search involves the
(re)application
of SPAS with control parameters
chosen
on the basis of the theory behind their operation,
and
is performed
to find data that eliminates
or reduces
uncertainty
(e.g. missing support
for expectations)
in
the signal’s current interpretation.
Because IPUS has the ability to selectively reprocess
uncertain
portions
of a signal with specialized
SPAS,
the framework
can potentially
play an additional
architectural
role: supporting
the use of approximate
processing techniques
to reduce the complexity
of front
ends by sacrificing
precision
in SPA output.
Approximate
processing
(Lesser et al., 1988) refers
to deliberate
limitation
of search processes in order to
trade off certainty
for reduced
execution
time.
Approximate
SPAS (ASPAs)
are SPAS whose processing
time can be limited in order to trade off their outputs’
precision
for reduced execution
time. The availability
of such SPAS permits
formulation
of perceptual
control strategies
that first use ASPAs to create a rough
picture
of the environment
that is refined only where
the front end outputs’
interpretations
are too uncertain.
Refinement
involves
reprocessing
these limited
signal portions
with SPAS that produce
outputs
havThese non-approximate
and poing greater precision.
tentially
highly specialized
SPAS would be expensive
if
applied to the entire signal, but if applied only in restricted signal regions their costs become manageable.
This paper examines
IPUS’ feasibility
as a framework for supporting
ASPAs within
the auditory
scene
analysis problem
(Bregman
1990), which involves the
segregation
and identification
of sounds in an acoustic signal.
Specifically,
our test application
focuses
on showing
that an IPUS-based
sound-understanding
testbed (SUT) can use ASPAs to adaptively
generate
spectrograms
that provide sufficient detail in the timefrequency
domain for recognizing
the sources responsible for generating
the input signal.
Two key questions
must be addressed
in evaluating
the suitability
of IPUS ( or, for that matter, any other
framework)
for ASPAs:
(1) whether
the framework
provides
enough structured
support
for the contextdependent
nature of ASPAs’ outputs,
and (2) whether
front-end
ASPAs’
time gains are overwhelmed
by interpretation
search and reprocessing
due to increased
uncertainty
in the ASPAs’ output.
This paper considers the first question in IPUS
and ASPAs,
and the
second question
in Performance
Evaluation.
The
paper ends with Analysis
and Conclusions.
662
PERCEPTION
& BEHAVIOR
IPUS
and
ASPAs
The first subsection
describes
how IPUS
supports
principled,
efficient,
selective (re)application
of SPAS.
The next subsection
shows why this benefits ASPAs,
using the Quantized
Short-Time
Fourier
Transform
awab
and
Dorken,
1995)
as
a
specific
ex(QSTFT) (N
ample. The last subsection
gives an abstract
trace of
an IPUS-based
system to unify the section’s concepts.
US Architecture
IPUS is instantiated
by a domain’s
formal signal processing theory, and has four components
for organizing and applying
signal processing
theory: discrepancy
detection,
discrepancy
diagnosis,
differential
diagnosis, and signal reprocessing.
(Lesser et al., 1995) These
components
have the following
functionality:
detect
actual
discrepancies
between
data observations,
diagnose these discrepancies
observational
uncertainty,
determine
reprocessing
and expected scenario
of the diagnosis,
and
data
expectations
and ascribe
and
reasons
for
strategies
for uncertain
data
changes, based on the results
determine
differential
diagnosis strategies
to disambiguate data with several alternative
interpretations.
The architecture
follows an iterative
process of “discrepancy
detection,
diagnosis,
reprocessing”
for converging on the appropriate
SPAS and interpretations.
Convergence
is driven by the goal of eliminating
or reducing various categories
of interpretation
uncertainty.
IPUS implements
perception
as the integration
of
search in a front-end-SPA
space with search in an interpretation
space. Uncertainty
in the current state in
one space triggers
search for an explanation
and resolution
of the ambiguity
or discrepancy
in the other
space.
In general,
the search process whose current
state produces the lower uncertainty
serves as the standard against which progress toward a complete
interpretation
or adequate
front end is measured
in the
other.
Within
the interpretation
search process “uncertainty”
refers to the portion
of the signal3 explained
by the current
interpretation
state and the strength
of the negative
(i.e. missing or incomplete)
evidence
against each hypothesis
in the interpretation.
Within
the front-end
search process “uncertainty”
refers to the
degree of inconsistency
found among the results from
SPAS whose outputs are supposed to be related according to their domain signal processing
theory.
Each time an SPA is executed within IPUS, the hypotheses representing
the execution’s
results are annotated
with the name of the SPA and the control
parameter
values used in the execution.
This annotation is the outputs’
parameter
context. In addition
to
for
31n the SUT,
by the current
percent
of input
interpretation.
signal
energy
accounted
the parameter
context,
each SPA output is annotated
with a processing
context, or a data structure
listing
the SPA sequence that generated
the hypothesis
from
the input signal.
Within
IPUS, three sets of information
(in addition
to SPA code) used to define SPAS are important
for
supporting
selective SPA (re)application.
The first is a
set of rules defining how individual
SPA control parameters should be modified
to eliminate
or reduce various
classes of distortions
that could be manifested
in the algorithm’s
outputs.
The second key definition
element
is a list of “supercontext
methods”
that take as input a
parameter-context
and an optional
“information
category” label. These methods return context patterns indicating
the range of values for each control-parameter
in an SPA parameter-context
that would permit
the
SPA to produce correlates
having the same or greater
detail in the specified “information
category”
as found
in the specified
parameter
context.
As a simple example, assume an SPA that selects local maxima from
a spectrogram
on the basis of whether
their energy
values are greater than a threshold
control-parameter.
The supercontext
method
for this SPA would, when
supplied
with a particular
parameter
context and the
information
category
“peaks,”
return
a pattern
indicating that any execution
of the SPA with a parameter context having threshold
values below that of the
given parameter
context
would
provide
at least the
same number of peaks as were produced
by the given
parameter
context.
The third key SPA definition
element is a mapping
function
that takes as input two parameter contexts and the output hypotheses
produced
from the first context (i.e. execution
of an SPA), and
returns a list of the hypotheses
modified
to reflect how
they would appear had they been produced
by the second context.
Together,
processing
contexts
and SPAS’ mapping
functions
enable IPUS-based
systems to examine their
reprocessing
history for processing
contexts that would
provide
SPA outputs
that were at least as detailed
as those required
by a current
reprocessing
request.
This process is called context mapping,
and, along with
IPUS’ diagnostic
support,
will be shown by the next
subsection
to be important
for efficient ASPA usage.
ASPA
The
(STFT)
X[n,
Illustration
discrete
(Nawab
k]
=
Short-Time
and Quatieri,
fJ
x[nL
Fourier
1988)
Transform
+ M + 7n]w[m]e-~2?rmk~N,
m=-00
O<k<N-l,OsM<L
is a common tool for representing
the time-dependent
frequency
content
of a discrete signal x[n]. Figure 2
shows how its matrix representation
can be viewed as a
picture
of time-dependent
frequency
tracks indicating
the presence of some signal-producing
sources.
Figure
2: Abstract
“Tracks”
in a STFT
Spectrogram.
An STFT instance has particular
values for its parameters:
analysis
window
length
(number
of signal
points L analyzed
at a time to produce
a column in
Figure 2’s matrix),
frequency-sampling
rate (number of
points N computed
per column in Figure 2’s matrix),
and decimation
interval
(signal points M between consecutive analysis window
positions).
For values of N
that are powers of 2, there is an efficient algorithm
for the STFT based on the Fast Fourier
Transform
(FFT),
which requires
O(nlogn)
real multiplications
and 0 (nlogn)
real additions.
Conceptually,
the algorithm computes
a series of FFTs on successive blocks
of L data points in the signal. Though commonly
used,
this version of the STFT has the drawback
of computing values for all points within the spectrogram
matrix,
whether
or not they are needed for interpretation.
The
Quantized
Short-Time
Fourier
Transform
(QSTFT) (N awab and Dorken, 1995) was developed
for approximating
a signal’s
STFT using an order of
magnitude
fewer additions
than the FFT-based
STFT
and no multiplications.
This performance
is achieved
through
first quantizing
each L-point
block in the signal to the set (-l,O,l),
backward-differencing
the quantized signal, and then applying
an O(n2) implementation of the Fourier
Transform
(i.e. the summation
of
the x[]w[]ej
t erms) to each block.
When compared
to STFTs with N’s up to 256, evaluation
of the basic QSTFT
for the entire frequency-domain
spectrum
takes fewer additions,
and no multiplications,
due to
the increased
number
of zeros in the modified
signal.
A band-limited
QSTFT
that computes
only a limited
region surrounding
the estimated
highest-energy
frequency generally
requires
fewer mathematical
operations than the complete-spectrogram
STFT for N’s up
to 1024.
Interpretation
of an STFT’s
(or, any other SPA’s)
output
depends
on the appropriateness
of the algorithm’s
parameter
values to the current
scenario.
It
can be shown through
analysis of Fourier theory that
a fixed STFT with a long analysis windows
will provide fine frequency
resolution
for scenarios containing
sources with- time-invariant
frequency
tracks, but ai
the cost of poor time resolution
for sources with timevarying
components.
Conversely,
a fixed STFT with
short window
lengths
will provide
fine time resolution for scenarios containing
sources with time-varying
components
such as chirps or reverberatory
decays, but
NAVIGATION
663
at the cost of poor frequency
resolution
for sources
with close frequency
components.
The band-limited
QSTFT
(and ASPAs
in general)
suffers from these
same context-dependent
issues, but its approximate
nature introduces
even more uncertainty
issues.
For
example, the termination
of a track in a QSTFT
spectrogram
can result not only from the actual signal cessation of a source or STFT-related
resolution
distortions, but also from the appearance
of new sources with
frequency
content that shifts the estimated
maximumenergy frequency
so that the computed
spectrogram
region does not include the track.
Thus, as signal sources change and interact
in complex scenarios,
perceptual
systems must be carefully
designed
to ensure that these changes can be interpreted at “face value” and are not the result of a distortion
introduced
by SPA parameter
values no longer
appropriate
to the current
context.
This issue becomes particularly
important
for ASPAs because of the
greater number of assumptions
involved in their design
(e.g. frequency
region with maximum
energy remains
stable, for QSTFT).
The IPUS framework’s
diagnostic
component
and SPA theory representation
address this
problem
by supporting
the focused (re)application
of
front-end
SPAS in regions of the signal where SPAS’ signal processing
theory indicates the possibility
of distortions from inappropriate
SPA parameter
values. These
(re)applied
SPAS are executed
with control
parameters chosen to provide more precise data that will confirm or disconfirm
the distortion
hypothesis.
In addition, the IPUS reprocessing
component’s
ability to use
context-mapping
(e.g. using earlier reprocessing
results
from a non-approximate
STFT instance
or an expensive QSTFT instance with very high frequency
resolution to eliminate
search for newly hypothesized
sources
with frequency
tracks that theoretically
should have
been present in the earlier results)
helps to preserve
ASPAs’ front-end
time gains.
We conclude with an abstract trace of an IPUS-system
execution
that unifies the concepts in this section. Figure 3 shows a hypothetical
interleaving
of progress in
the two IPUS search spaces.
The system behavior
can be summarized
as follows.
Initially,
the interpretation
system uses front end A
with ASPA SPA1 to collect evidence,
and hypothesizes that one perceptual
object of type Hl is present.
Attempting
to account for more signal energy, the system then explores the interpretation
state (
and finds that A’s SPA sequence has also already produced evidence
to support
the interpretation.
When
attempting
to explain the remaining
signal energy, the
system finds that an additional
single object of either
type Hl, H2, or H5 could be hypothesized.
Choosing
H2 first (i.e. state {Ml,W2,W3)),
the system’s discrepancy
detection
finds that A does not provide
evidence for the H2 instance.
When discrepancy
diagnosis
664
PERCEPTION
&I BEHAVIOR
A INTERPRETATIONSPACE
B FRONT-ENDSPACE
Figure
3: Figure
3A shows
a system’s
progress
within
its
interpretation
space.
Labels
outside
each state
indicate
the
front
end(a)
being
used
to find
support
evidence
for
the
state’s
interpretation
(set of object
instances
Hn).
Figure 3B shows
the front
ends
explored
by the system.
Labels outside
each state
indicate
the interpretation
expected
for the front
end’s outputs
and whether
the outputs
actually
supported
it.
shows that SPAl’s
current parameters
do not provide
enough detail for the interpretation,
the system’s reprocessing
component
generates
and applies front end
23’s SPAS to selected regions
of the signal, and this
time finds negative evidence for H2’s instance, causing
it to abandon
interp
e
proceed to explore (
.
end B fortuitously
serve as a supercontext
of a frontend that provided,
via context mapping,
indisputable
negative
evidence for any instance of
system to explore interpretation
state
This time discrepancy
detection
shows
provide
positive
evidence
for the second instance
of
type Hl; however, the system’s discrepancy
diagnosis
component
finds that 23 was inappropriate
to the interpretation.
The system’s reprocessing
component
then
uses SPA theoretic
constraints
to determine
that front
end C, by using non-approximate
SPA3 in a limited
portion
of the signal, should be appropriate
for supporting
or disproving
the existence
of the extra Hl.
According
to Figure 3B the outputs
produced
by the
new front end do in fact support
the second Hl hypothesis,
and ultimately
support
the creation
of a fiThe final interpretation
state is
and because it accounts for enough
retation
search stops.
erformance
Evahation
The first subsection
describes
the environment
in
which IPUS SUTs are evaluated,
the next section describes the three SUT versions evaluated,
and the final
section lists the experimental
results.
Evaluation
Domain
For the evaluation
experiments
presented
in this paper the SUT was supplied
with a sound-model
library
containing
40 common
sound-sources.
The sounds
were specifically
selected to provide a reasonably
com-
plex subset of the acoustic
behaviors
(e.g. impulsive,
harmonic,
periodic,
chirping)
and sound interactions
(e.g. masking, start/end
time blurring,
overlapping
frequency content)
that can arise in random
real-world
auditory
scenarios.
(Klassner , 1996) provides
a full
catalogue
of the library
sounds and their models. The
sounds’ durations
ranged from 0.2 to 30.0 seconds.
As an indication
of the potential
for interactions
among sounds randomly
selected from the library
and
placed in scenarios with random
start times, it should
be noted that the expected
frequency
range of each
narrowband
track (e.g. < 100 Hz wide) of each library
sound overlaps a track of at least one other sound. For
each track of a given sound, on average another
4.2
sounds have overlapping
frequency
content.
Note that
the greater the number of overlapping
tracks there can
be in a spectral region, the greater the amount
of interpretation
search that must be done to determine
(1)
whether in fact overlapping
tracks are present in a scenario, and (2) w h ic h subset of the tracks that could be
in the region of overlap are actually
present.
Experiment
Design
The goal of the experiments
in this paper is to indicate
indicate
how well ASPAand non-ASPA-based
IPUS
SUTs handle complex
environments,
and with what
types of costs for front-end
search and interpretation
search.
For this paper,
“complex
environments”
are
those having three or more sounds that share some
frequency
content occur at overlapping
time periods.
The following
5-step method
was used to generate 15 complex acoustic scenarios.
First, four sounds
were randomly
selected from the SUT library.
Second, a random
instance
of each sound was selected
(each sound had at least 5 instances,
sampled
at 16
KHz).
Third,
start-times
for each instance
were randomly selected with uniform
distribution
within
a 7second base timeframe.
Fourth,
a 5-second
window
was randomly
chosen within
the base timeframe
such
that all four sounds were included
for at least their
When
length
or 1 second,
whichever
was shorter.
start times precluded
such a window,
steps 3 and 4
were repeated
until this criterion
was met. Fifth, each
scenario was scaled so that all had the same average
power. Since some sound-creation
events, such as footsteps and phone ring sequences, are really composed of
several instances,
the average number
of instances
in
each scenario is 7.3 rather
than four, as might have
been expected.
Two primary
experiment
runs were perfomed
on the
same 15 scenarios.
The first (LoRes) used a version of
the IPUS SUT whose default front end (i.e. the SPAS
routinely
applied
in the first analysis
of the signal)
contained
a non-approximate
STFT, with N = 512,
L = 256, and M = 0. It was directed
to use nonapproximate
STFTs in limited
signal regions during
reprocessing.
The second (Appr) was identical
to the
first, except that the default
front end contained
a
Front
SPA
Search
cost
Interp.
Search
cost
System
Perform.
End:
Appr
LoRes
HiRes
13.70
2.5e6
16.48
0.97
15.51
0.56
0.42
0.67
0.24
7.45
6.le6
14.10
1.07
12.03
0.61
0.43
0.65
0.22
3.20
5.5e7
8.14
0.86
7.28
0.60
0.39
0.67
0.19
r
Param
Cntxt
Total
Ops
Total
Hyps
Answers
Nonanswers
Hit Rate
FAlarm
Rate
Track+
Rate
TrackRate
Table
1: Experiment
Results.
SPA-search
cost is averaged per scenario,
while
interpretation-search
cost and system performance
are averagedper
scenario
sound
instances.
Note
that
“Total
Ops”
includes
both additions
and multiplications
performed
during
both initial
front-end
analysis
and reprocessing.
band-limited
QSTFT
SPA with N = 512, L = 256,
M = 0, and a lOOO-Hz band radius.
This second version was directed to use band-limited
QSTFT’s
in restricted
signal regions during
reprocessing.
A third
reference experiment
(HiRes) was performed
on the 15
scenarios with a SUT having a default front end that
contained
a non-approximate
STFT with N = 2048,
L = 1024, and M = 128.
All SUT versions modelled STFT-induced
time- and frequencyresolution
and QSTFT-induced
windowing
distortions
in their diagnostic components,
as well as distortions
for other
front-end
SPAS applied to spectrogram
results.
Results
Table 1 reports statistics for the SUT versions’ performance in three evaluation
categories:
SPA-search
cost: the number
of time-frequencySPA reprocessing
parameter
contexts
per scenario
(Param
Cntxt)
and total
number
(first-pass
+ reprocessing)
of spectrogram-based
mathematical
operations (additions
and multiplications)
per scenario (Total Ops) are reported.
Interpretation-search
cost: the average number
of answer hypotheses
(both false alarm and hits), and
the average number of considered
but rejected soundsource hypotheses
are reported.
System
Performance:
hit rate and false-alarm
rate are reported,
as well as the duration
for which
“hit”
sound instances
were tracked relative
to the total amount of time for which all sound instances lasted
(Track+
Rate)
and the duration
covered by all false
alarm answer hypotheses
relative to the total time covered by all answer hypotheses
(TrackRate).
Analysis
and
Conelusions
With the understanding
that the scope of the experiments is limited,
two basic conclusions
can be drawn
from the experiment
results:
NAVIGATION
665
1. the Appr and LoRes columns of Table 1 indicate that
it is reasonable
to consider
using ASPAs in IPUSbased acoustic interpretation
systems to trade off
front-end
complexity
for moderate
increases in interpretation
search, and
2. the system performance
rate in Table l’s HiRes column, when compared
with that found in the Appr
and LoRes columns,
shows that while commitment
to detailed initial front-end
processing
can save interpretation
search, it is not guaranteed
to outperform
ASPA-based
strategies,
even in complex scenarios.
The first conclusion
is based on the observation
that
the Appr SUT achieved
system performance
similar
to the LoRes SUT, and took only 41% of the frontend mathematical
operations
that the LoRes SUT required. This is significant
given that both systems have
the same initial resolving
power.
Examination
of the
sounds missed by the Appr SUT shows that the hit
rate difference is due solely to sounds whose entire frequency content fell outside the QSTFT’s
spectrogram
window.
All SUT versions included
a simple thresholdbased SPA that tracked time-domain
signal energy relative to explained
time-frequency
energy, and triggered
reprocessing
when the ratio dropped below a threshold.
We believe that a moderately
more sophisticated,
lowcost SPA could be designed
to cause the Appr SUT
to increase interpretation
search and find the missed
sounds. We also note that the Appr’s increased number
(15% greater)
of considered
interpretation
hypotheses
relative
to the LoRes’s did not adversely
affect overall
system time because the verification
process for many
of the extra sounds involved
either context resuse or
verification
of only one narrowband
track of a hypothesis that was then disbelieved.
The second conclusion
is based on the similar system
performance
rates between
the Appr and LoRes systems as a group and the HiRes system. Note that Appr
took only 5% of the total spectrogram-oriented
operations required
by the HiRes system. The fourfold
frequency resolution
gain afforded
by the HiRes system’s
default front end did not significantly
improve
its performance
over either of the lower-resolution
systems.
Since the experiment
scenarios represent
rather acoustically
overloaded
environments
(i.e. several simultaneous sources having rapid changes in time-frequency
characteristics),
this result further
encourages
consideration of ASPAs for use in interpretation
problems.
Even though
the result of using ASPAs in our example application
is promising,
it is important
to temper our hopes and conclude
this paper with the understanding
that different
perceptual
domains and applications
can have widely differing
balances between
front-end
and interpretation
costs.
For example,
in
some domains
a reduction
in overall front-end
costs
by as little as 10% could be very valuable
if high-level
interpretation
costs are small, and there is not significant additional
interpretation
search caused by uncertainty introduced
by approximate
front-end
process666
PERCEPTION
& BEHAVIOR
ing. In other situations,
however, where interpretation
costs are extremely
high, a reduction
of front-end
costs
through
use of ASPAs even by 80% may not be advantageous, if it engenders
a slight increase in interpretation search.
Acknowledgment
This research was sponsored
by the Department
of the
Navy, Office of the Chief of Naval Research, under contract number
ONR #N00014-95-l-1198.
The content
of this paper does not necessarily
reflect the position or
policy of the government,
and no official endorsement
should be inferred.
eferenees
Bregman,
A., Auditory
Scene Analysis:
The Perceptual Organization
of Sound. MIT Press. 1990.
Dorken, E., Nawab, S. H., and Lesser, V., “Extended
model variety analysis for integrated
processing
and
understanding
of signals,”
Proc. of 1992 IEEE Conf.
on Acoustics,
Speech and Signal Processing,
vol. V,
pp. 73-76, San Francisco,
1992.
Draper,
B., “Learning
object recognition
strategies,”
Ph.D. thesis, Computer
Science Dept., Univ. of Massachusetts, Amherst,
MA, 1993.
Ellis, D., “Prediction-driven
computational
auditory
scene analysis,”
Ph.D. thesis, Electrical
Engineering
and Computer
Science Dept., MIT, 1996.
Klassner,
F., “Data
reprocessing
in signal understanding
systems,”
Ph.D. thesis, Computer
Science
Dept., Univ. of Massachusetts,
Amherst,
MA, 1996.
Kohl,
C., Hanson,
A., and Reisman,
E., “A goaldirected
intermediate
level executive
for image interpretation,”
IJCAI-87,
pp. 811-814,
Milan, Aug. 1987.
Lesser, V., Pavlin, J., and Durfee, E., “Approximate
processing
in real-time
problem
solving,”
AI Magazine, vol. 9, no. 1, pp. 49-61, Spring 1988.
Lesser, V., Nawab, H., and Klassner,
F., “IPUS: an
architecture
for the integrated
processing
and understanding
of signals,”
Artificial
Intelligence,
vol. 77,
no. 1, pp. 129-171,
Aug. 1995.
Marr, D., Vision. San Francisco:
W. H. Freeman &
Co. 1982.
Nawab, H., and Dorken, E., “Quality
versus efficiency
tradeoffs in STFT computation,”
IEEE Trans. on Signal Processing,
April 1995.
Nawab,
H. and Quatieri,
T., “Short-time
fourier
transform,”
Advanced
Topics in Signal Processing,
Prentice Hall, NJ, 1988.
Strat, T., “Natural
object recognition,”
Ph.D. thesis,
Computer
Science Dept., Stanford,
Aug. 1991.
Tsotsos, J., “The Complexity
of Perceptual
Search
Tasks,” IJCAI-89,
pp. 1571-1577,
Detroit,
Aug 1989.

