An Integro-Differential Equation Technique for the HV Power Transmission Lines
488 IEEE TRANSACTIONS ON POWER DELIVERY, VOL. 20, NO. 1, JANUARY 2005
An Integro-Differential Equation Technique for the
Computation of Radiated EMI Due to Corona on
HV Power Transmission Lines
S. K. Nayak and M. Joy Thomas
Abstract— This paper presents a novel technique for the computation of radiated electromagnetic interference (EMI) levels due to corona on high-voltage (HV) transmission lines. The EMI levels computed using the present technique for various HV transmission lines from around the world matches well with the experimentally measured values, thus validating the present technique. Using the technique developed, the influence of transmission line length, distance of observation point from the line, conductor diameter as well as the transmission line configuration on the radiated EM field has been studied. It is seen that for observation points which are close to the transmission line corridor, the total radiated electric field remains almost constant for line lengths above 1500 m. For observation points which are far away, a longer length of the line needs to be considered for computation of the total electric field. In the study, it is seen that the transmission line conductor height and line configuration have marginal influence on the radiated electric field.
Index Terms— Corona, electromagnetic interference (EMI), high-voltage transmission lines, radio interference (RI), radio noise (RN).
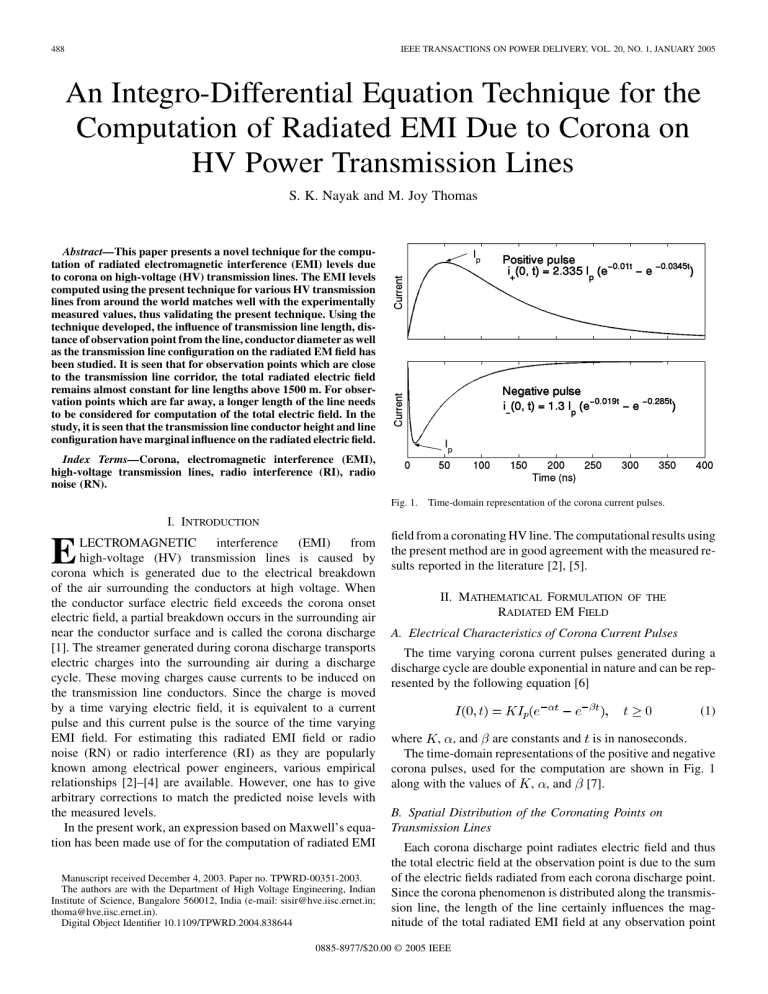
Fig. 1.
Time-domain representation of the corona current pulses.
I. I NTRODUCTION
E LECTROMAGNETIC interference (EMI) from high-voltage (HV) transmission lines is caused by corona which is generated due to the electrical breakdown of the air surrounding the conductors at high voltage. When the conductor surface electric field exceeds the corona onset electric field, a partial breakdown occurs in the surrounding air near the conductor surface and is called the corona discharge
[1]. The streamer generated during corona discharge transports
electric charges into the surrounding air during a discharge cycle. These moving charges cause currents to be induced on the transmission line conductors. Since the charge is moved by a time varying electric field, it is equivalent to a current pulse and this current pulse is the source of the time varying
EMI field. For estimating this radiated EMI field or radio noise (RN) or radio interference (RI) as they are popularly known among electrical power engineers, various empirical
relationships [2]–[4] are available. However, one has to give
arbitrary corrections to match the predicted noise levels with the measured levels.
In the present work, an expression based on Maxwell’s equation has been made use of for the computation of radiated EMI field from a coronating HV line. The computational results using the present method are in good agreement with the measured re-
sults reported in the literature [2], [5].
II. M
ATHEMATICAL
F
ORMULATION OF THE
R ADIATED EM F IELD
A. Electrical Characteristics of Corona Current Pulses
The time varying corona current pulses generated during a discharge cycle are double exponential in nature and can be rep-
resented by the following equation [6]
(1) where , , and are constants and is in nanoseconds.
The time-domain representations of the positive and negative corona pulses, used for the computation are shown in Fig. 1 along with the values of , , and
Manuscript received December 4, 2003. Paper no. TPWRD-00351-2003.
The authors are with the Department of High Voltage Engineering, Indian
Institute of Science, Bangalore 560012, India (e-mail: sisir@hve.iisc.ernet.in; thoma@hve.iisc.ernet.in).
Digital Object Identifier 10.1109/TPWRD.2004.838644
B. Spatial Distribution of the Coronating Points on
Transmission Lines
Each corona discharge point radiates electric field and thus the total electric field at the observation point is due to the sum of the electric fields radiated from each corona discharge point.
Since the corona phenomenon is distributed along the transmission line, the length of the line certainly influences the magnitude of the total radiated EMI field at any observation point
0885-8977/$20.00 © 2005 IEEE
NAYAK AND THOMAS: AN INTEGRO-DIFFERENTIAL EQUATION TECHNIQUE FOR THE COMPUTATION OF RADIATED EMI 489 away from the line. It is observed that in fair weather there exists a certain shielding effect when one source in corona does not permit another within about 20–50 cm distance, i.e., the distance between two adjacent corona discharge points lies in the range
of 20–50 cm in fair weather conditions [7]. Also, it has been
observed that on an overhead HV power line, positive corona pulses from a single point in corona occur once in a cycle, or at the most, two or three pulses are generated near the peak of the
voltage waveform [7]. So, for the computation, the entire trans-
mission line length is divided into elementary segments each containing a coronating point and the radiated electric field for the total line at the observation point is the summation of the electric field radiated from each of the segments.
When the double exponential corona current pulse gets injected and propagates along the line, electromagnetic waves are radiated by the transmission line conductor. The expression for the radiated electric field can be derived from Maxwell’s equation by applying Lorentz Gauge condition and using Green’s function. The derived expression for the radiated EMI field at
the observation point “O” is as follows [8]:
Fig. 2.
Configuration of the transmission line used in the computation.
To compute the value of radiated electric field as given by
(2), the length of the line is divided into a number of elementary segments “ ” of length 50 cm, since the distance between two adjacent coronating point is assumed to be 50 cm. Each 50 cm is further divided into a number of subsegments ‘ ’.
The space-time variation of radiated electric field at point “O” due to conductor corona and its image for an elementary length of the line , is given as follows:
(2)
(3) where
;
; vector in the direction of the conductor; vector in the direction of the image conductor; velocity of light in free space; double exponential corona current pulse, as shown in
Fig. 1; distance between the corona source point on the conductor and the observation point “O”; distance between the corona source point on the image conductor and the observation point “O”.
Assumptions made in this work
• The corona is uniformly distributed throughout the transmission line.
• The distance between two adjacent corona sources is
50 cm.
• For the computational purpose, the maximum length of the line has been taken as 2000 m.
• Since “+ve” corona pulses are of higher magnitude, the radiated field due to them only have been considered for the computation of maximum radiated EM field.
• The sag on the transmission line conductors has been neglected.
where
The influence of ground resistance has been considered by suitably modifying the depth of the image conductor, as sug-
is the attenuation constant
C. Calculation of the Peak Value of the Corona Current Pulse
Let the line to ground voltage on the three phase lines be
, and , respectively.
The voltage on the ground wire is taken to be zero.
The peak value of the conductor charge is given by
(4) where and trices, respectively.
are the voltage and potential coefficient ma-
490 IEEE TRANSACTIONS ON POWER DELIVERY, VOL. 20, NO. 1, JANUARY 2005
TABLE I
C OMPARISON OF EMI L EVELS A MONG THE M EASURED , E MPIRICAL AND THE P RESENT M ETHOD
The peak value of conductor surface electric field is given
Hence, the peak value of the corona current pulse propa-
gating along the transmission line conductor is given by [9]
(5) where number of subconductors; radius of the bundle; radius of the subconductor.
The corona current injected into the transmission line conductor during the corona discharge is given by where charge of the electron;
mobility of electron [6], [10].
(7)
(6)
This peak value of the corona current pulse has been used in (3).
For the computation of radiated electric field, a transmission line as shown in Fig. 2 has been taken up for the study.
The transmission line phase conductors are at a height of and are assumed to be stressed with a voltage at power frequency.
The ground wires are placed at a height of . The influence of ground wires and the image conductors on the radiated electric field have also been taken into consideration. When a double exponential corona current pulse as shown in Fig. 1 is injected
NAYAK AND THOMAS: AN INTEGRO-DIFFERENTIAL EQUATION TECHNIQUE FOR THE COMPUTATION OF RADIATED EMI 491
Fig. 3.
Comparison of measured and computed radiated electric field levels for different lines.
Fig. 5.
Variation in peak value of the radiated electric field with length of the coronating line.
levels agree reasonably well with the measured data. The calculated levels along with the measured levels appear in Fig. 3.
Fig. 4.
Time-domain radiated electric field for different coronating line lengths.
B. Variation of Radiated Electromagnetic Field With Line
Length
The computed radiated electric field in the time domain at the measurement point for different lengths of the line are presented in Fig. 4. The shape and pulse duration of the electric field remains the same as the length of the line increases but the peak value increases with the line length.
Fig. 5 shows the variation in peak value of radiated electric field in decibels for the same observation point. It can be observed that the field increases rapidly with increase of coronating line length up to 500 m and becomes almost constant for line lengths close to 1500 m. The radiated electric field for a line length of 1500 m at the observation point is 46.1 dB and for a length of 2000 m it is 46.6 dB. Hence, it is suggested that for computation of EMI field due to corona close to the transmission line corridor ( 15 m), a line length of 750 m on either side of the observation point is good enough to get accurate results.
into the conductor during a discharge process, it radiates an electric field which is computed at the observation point “O”. The observation point is assumed to be at a height of 2 m from the ground. The effect of transmission line length and other parameters on the radiated EMI field are discussed in the following sections after comparing the computed EMI field with the measured values.
III. R ESULTS AND D ISCUSSIONS
A. Comparison of Measured and Calculated EMI Levels
The EMI levels calculated using the method presented in the earlier section are compared with the fair weather measured data of 38 different transmission lines from around the world. Table I
summarizes the radiated field data obtained from the survey [2],
[5] and by using the present method. The table also shows the
data obtained using the various empirical formulae. The data are arranged in ascending order of the system voltage level in kilovolts. As can be seen from the table, the fair weather computed
C. Variation of Radiated Electromagnetic Field With
Observation Distance
The electric field levels are not the same at all the observation points as the radiated electric fields are greatly dependent on the observation distances. The variation of electric field at various observation distances (0–2000 m) with different line lengths
(0–1500 m) are shown in Fig. 6. When the observation point is just below the line, the radiated EMI level is almost 20 dB higher than when the observation point is at 2000 m for a line length of 1500 m. It can also be seen that as the observation point is moved away from the HV transmission line, the line length which makes the total radiated electric field constant also increases. Hence, it is suggested that depending on the observation distance, the line length used in the computation should also be decided.
492 IEEE TRANSACTIONS ON POWER DELIVERY, VOL. 20, NO. 1, JANUARY 2005
Fig. 6.
Variation in peak value of the radiated electric field with length of the coronating line for various observation distances from the line.
Fig. 8.
Variation in the radiated electric field with length of the coronating line for different configurations of the transmission line.
So, the radiated electric field level is lower when the transmission line conductor height is lower.
From this, we can conclude that as the height increases, the radiated electric field level decreases. But after a certain lateral distance, the difference in radiated electric field levels for different heights show a reverse trend.
D. Variation of Radiated Electromagnetic Field With Line
Length for Different Line Configurations
Fig. 7.
Variation in radiated electric field with observation distance for different line heights.
Fig. 7 shows the variation in radiated electric field levels for transmission line heights of 15.2, 20.2, and 25.2 m. The variation in the levels are only marginal as the difference of height is less as compared to the wavelength of the electromagnetic signal radiating from the line due to corona discharge. Generally, the radiated electric field at an observation point which is at a lateral distance of “d” is related by
In Fig. 8, the radiated electric field level with line length for three different line configurations have been studied. The radius of the transmission line conductors and the observation distance are the same for all the three configurations. When the transmission line conductor is excited by a voltage of 280 kV
(line-line), the radiated electric field levels for a line length of
1500 m for line configurations A, B, and C (shown in Fig. 8) are 44.4, 45, and 46.1 dB, respectively. The observation point is at 15 m from the outer phase conductor. These field values have
also been confirmed by experimental measurements [5]. This in-
dicates that the line configuration does not have much influence on the EMI level, due to the small variation in the surface electric fields of the conductors for the three different configurations.
(8)
E. Variation of Radiated Electromagnetic Field With Line
Length for Different Subconductor Diameters when
(9)
So, the radiated electric field level is higher when the transmission line conductor height is lower, when
(10)
The diameter of the subconductor of a bundled conductor has a significant effect on radiated electromagnetic field. Fig. 9 shows the variation in radiated electric field levels for various conductor diameters. The radiated electric field levels at the observation point of 15 m for the conductor length of 1500 m and conductor diameters of 4.17, 3.17, and 2.17 cm are 42.5, 46, and
51 dB, respectively. As the diameter of the conductor increases, the conductor surface field decreases and hence the radiated electric field levels at the measurement point also decreases.
NAYAK AND THOMAS: AN INTEGRO-DIFFERENTIAL EQUATION TECHNIQUE FOR THE COMPUTATION OF RADIATED EMI 493
• The effect of phase spacing on radiated EMI level is much more significant as compared to the effect of conductor height.
• The diameter of the subconductors influences the radiated electric field significantly.
A CKNOWLEDGMENT
The authors thank the authorities of Indian Institute of Science, Bangalore, for the permission to publish the paper.
Fig. 9.
Variation in radiated electric field with length of the coronating line for different subconductor diameters.
IV. C ONCLUSIONS
In this paper, a new technique has been described to compute the radiated electric field levels due to a coronating HV transmission line using a field theoretical approach. It has been shown in the paper that the radiated field levels computed using the proposed technique matches very closely with the experimentally measured values for a large number of HV transmission lines from around the world. The proposed technique has been shown to be better than those based on existing empirical formulae which are currently being used for the design of HV transmission lines. The important conclusions arising out of the present work are as follows.
• When the length of the transmission line conductor increases, the peak value of the radiated EMI field at the observation point increases but the pulse duration remains constant.
• For the computation of EMI field at an observation point close to the transmission line corridor, a line length of 750 m on either side (total line length 1500 m) of the observation point is good enough to get fairly accurate results.
• When the observation point is moved away from the HV line, the conductor length used in the computation of total
EMI field should be appropriately increased to get accurate results.
• To keep the radiated EMI field with in the permitted level at the observation point, the diameter of the line conductors should be chosen appropriately.
• The transmission line conductor configuration does not significantly influence the radiated EMI level.
R EFERENCES
[1] F. W. Peek, Dielectric Phenomena in High-Voltage Engineering , 3rd ed.
New York: McGraw-Hill, 1929.
[2] “Comparison of radio noise prediction method with CIGRE/IEEE survey results,” IEEE Trans. Power App. Syst.
, vol. PAS-92, pp.
1029–1042, May/Jun. 1973.
[3] R. G. Olsen, S. D. Schennum, and V. L. Chartier, “Comparison of several methods for calculating power line electromagnetic interference levels and calibration with long term data,” IEEE Trans. Power Delivery , vol.
7, pp. 903–913, Apr. 1992.
[4] R. G. Olsen and S. D. Schennum, “A method for calculating wide band electromagnetic interference from power line corona,” IEEE Trans.
Power Delivery , vol. 10, pp. 1535–1540, Jul. 1995.
[5] “CIGRE/IEEE survey on extra high voltage transmission line radio noise,” IEEE Trans. Power App. Syst.
, vol. PAS-92, pp. 1019–1028,
May/Jun. 1973.
[6] P. S. Maruvada, Corona Performance of High-Voltage Transmission
Lines .
Baldock, U.K.: Research Studies Press Ltd., Apr. 2000.
[7] R. D. Begamudre, Extra High Voltage A.C Transmission Engineering ,
2nd ed.
New Delhi, India: New Age International (P) Limited, 1990.
[8] R. Mitra, Computer Techniques for Electromagnetics , 1st ed.
New
York: Pergamon, 1973.
[9] M. R. Moreau and C. H. Gary, “Predetermination of the radio interference level for high voltage transmission lines: Part II—Field calculation method,” IEEE Trans. Power App. Syst.
, vol. PAS-91, pp. 292–304,
Jan./Feb. 1972.
[10] D. K. Davies, Measurements of Swarm Parameters in Dry Air, Air Force
Weapons Laboratory, Theoretical Notes no. 346, May 1983.
S. K. Nayak received the B.E. degree in electrical engineering from the University College of Engineering, Burla, India, and the M.Sc. (Eng.) degree in high-voltage engineering from the Indian Institute of Science, Bangalore, India, where he is currently pursuing the Ph.D. degree.
M. Joy Thomas (M’94) received the B.Tech. degree in electrical engineering from Institute of Technology, Varanasi, India, and the M.Sc. (Eng.) and Ph.D.
degrees in high-voltage engineering from the Indian Institute of Science, Bangalore, India.
He is presently an Assistant Professor at the Department of High Voltage
Engineering, Indian Institute of Science. His areas of interest are EHV power transmission, transients in power systems, HV engineering, GIS, EMI/EMC, and pulsed power engineering.
