From: AAAI-86 Proceedings. Copyright ©1986, AAAI (www.aaai.org). All rights reserved.
CONNECTION
MACHINE
STEREOMATCHING
Michael Drumheller
Thinking Machines Corporation
245 First Street
Cambridge, Massachusetts 02142
Abstract:
This paper describes a parallel real-time
stereomatching algorithm and its implementation on the
Connection MachineTM computer, a new massively parallel
computing system. The main features of the algorithm are
1) real-time performance, 2) the full exploitation of the OPdering constraint,
3) a representation that easily maps onto
a parallel computer architecture, and 4) the ability to efficiently use a variety of matching primitives. Some results,
including timings, are shown for both real and synthetic
data. Also discussed are the use of color information and
some subtle variations of the basic algorithm.
I
m
e
m
c
,:
r 4096
Introduction
Research on stereomatching has been, until recently, a slow
and painstaking process. Most stereo algorithms are computationally expensive, requiring many seconds, minutes,
or even hours to run on conventional computers.
Such a
long feedback delay for changing the algorithm or the data
makes it impractical to refine stereo algorithms by experimental methods.
In this paper we will show how a fine-grained massively
parallel computer has been used to solve the speed problem and to develop a new stereomatching algorithm. The
algorithm was outlined in a section of [2].
2
0
Description
of the
Machine
computer
Connection
The Connection Machine computer is a fine-grained massively parallel computing system designed and built by
Thinking
Machines
Corporation
for
research
in
artificial intelligence. The prototype contains 65,536 l-bit
serial processors which can communicate with each other
by two distinct mechanisms. One of these mechanisms has
the topology of a boolean 16-cube and is called the router
network, or simply “the router.” The other mechanism consists of a four-connected x-y grid called the north-east-westsouth connections,
or “NEWS.” NEWS is used for operations requiring local communication, such as convolutions
and relaxation algorithms.
The router is used for global
operations such as permuting, sorting, merging, summing,
histogramming, region-growing and image sampling. Each
processor has 4K bits of memory. The machine is programmed in a single instruction,
multiple data fashion from
a host computer such as a Lisp MachineTMor a VAXTM. The
computations performed by a particular processor depend
on the data contained in that processor’s memory. For example, the host machine may broadcast a request to each
processor to add two numbers together, conditional upon
whether the processor contains a particular piece of data.
748 / ENGINEERING
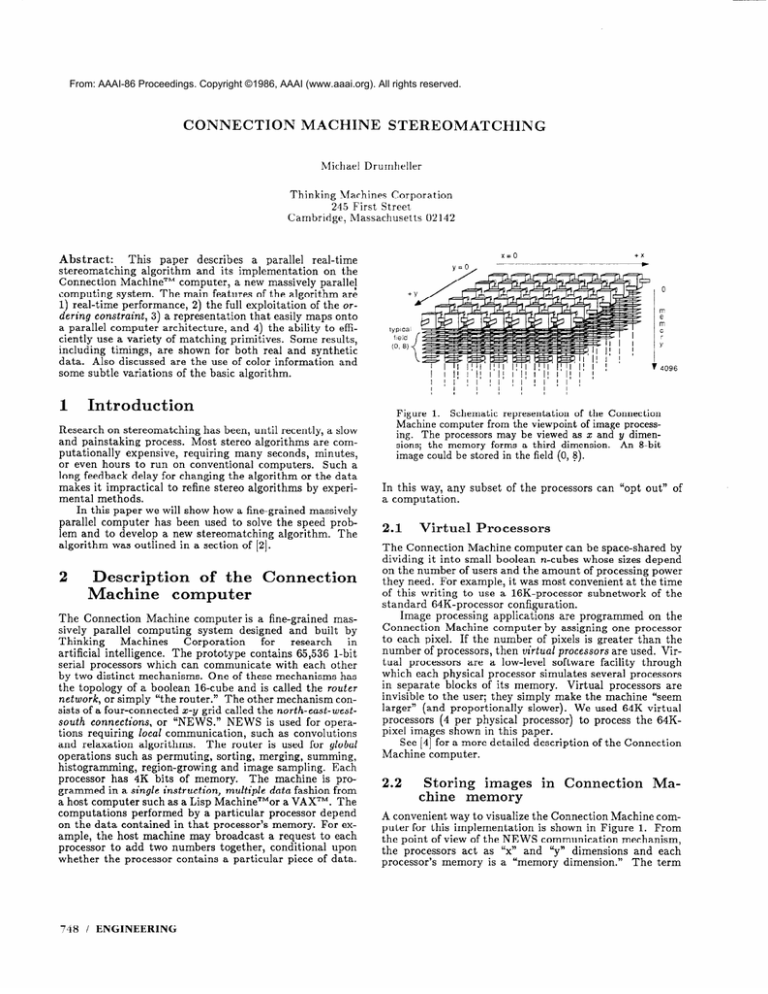
Figure 1. Schematic representation of the Connection
Machine computer from the viewpoint of image process-
ing. The processors may be viewed as z and y dimen-
sions; the memory forms a third dimension.
image could be stored in the field (0, 8).
An 8-bit
In this way, any subset of the processors can “opt out” of
a computation.
2.1
Virtual
Processors
The Connection Machine computer can be space-shared by
dividing it into small boolean n-cubes whose sizes depend
on the number of users and the amount of processing power
they need. For example, it was most convenient at the time
of this writing to use a 16K-processor subnetwork of the
standard 64K-processor configuration.
Image processing applications are programmed on the
Connection Machine computer by assigning one processor
to each pixel. If the number of pixels is greater than the
number of processors, then virtual processors are used. Virtual processors are a low-level software facility through
which each physical processor simulates several processors
in separate blocks of its memory. Virtual processors are
invisible to the user; they simply make the machine “seem
larger” (and proportionally slower). We used 64K virtual
processors (4 per physical processor) to process the 64Kpixel images shown in this paper.
See (41 for a more detailed description of the Connection
Machine computer.
2.2
Storing
images
chine memory
in
Connection
Ma-
A convenient way to visualize the Connection Machine computer for this implementation is shown in Figure 1. From
the point of view of the NEWS communication mechanism,
the processors act as “x” and “y” dimensions and each
processor’s memory is a “memory dimension.” The term
field will be used to refer to a rectangular
block of memory
underlying the entire NEWS grid and occupying a contiguous segment of the memory dimension. A field is denoted
(address,
length).
For example, an &bit video image might
be contained in the field (0,s) which occupies memory locations O-7 in every processor (see Figure 1). In this way, each
processor represents a pixel. Since the amount of memory
in each processor is large compared to the length of a typical intensity value (usually 8 bits), the machine can hold
many different superposed images.
L, (a radial line from
I
eye
Rcright
epipolar
A simple Connection
Machine
stereomatching
algorithm
3
Compute
primitives
Compute
potential
Choose
constraints
matches
between
primitives.
of local suport
correct matches
on uniqueness
Matching
3.1
for matching.
the amount
Determine
match.
(left eye epipolar line)
for each potential
on the basis of local support
and ordering.
Z-D
chine
features
on
convolution
computer
the
Connection
Ma-
Convolutions are performed by collecting intensity values
from nearby processors via the NEWS mechanism, multiplying the values by a broadcast constant, i.e., the appropriate filter weight, and accumulating the product. These
steps occur in parallel for all pixels. Some timings for gaussian convolutions are given in Table 1.
The time complexity of convolutions computed in this
way is independent of the size of the image and proportional
to the size of the filter.
TOTAL DIAMETER
OF
GAUSSIAN MASK
(PIXELS)
CENTRAL
WIDTH
"SIGMA"
(PIXELS)
CONVOLUTION TIME
ON THE
CONNECTION MACHINE
(SECONDS)
1.2
0.022
13
31
2.2
5.2
0.042
0.107
49
8.2
0.180
Table 1, Actual timings for gaussian convolution on the
Connection Machine computer. It should be noted that
these figures are for a true gaussian convolution computed
using a sampled gaussian kernel, not for the commonlyused approximation
Figure 2. Schematic representation of stereomatching geometry (redrawn from 61). This diagram represents the
1-D stereomatching pro b lem at a particular y coordinate,
that is, for a pair of epipolar lines or scanlines. The black
and white circles are potential matches, or points in x-d
space where the features from both images are compatible. The black circles are hypothetical correct matches.
The uniqueness constraint states that there can be at
most one match along any radial line from either eye (such
as L1 and L,).
and
This algorithm does not require a particular type of matching primitive. Many different types of primitives could be
used; see [I] or [8] for examples. All results shown in this
paper were obtained using zero crossings [5]. We have used
other features; these will be discussed later.
In our implementation we first convolved the image with
a small gaussian filter, then detected zero crossings in the
output of a discrete laplacian operator.
3.1.1
line)
obtained by iterated local averaging.
3.2
Computing
potential
matches
The set of potential matches in a one-dimensional stereomatching problem, i.e., for a pair of corresponding epipolar
lines, can be represented by the diagram in Figure 2. These
diagrams can be “stacked” perpendicular to the page to
obtain
a three-dimensional
representation
set of potential
of the stereomatching
matches.
This
problem is very con-
venient for mapping
a stereo algorithm
into the Connection Machine computer,
since the resulting set of potential
matches can be stored in a field in the machine (see Figure
3, compare with Figures 1 and 2).
For simplicity, we have assumed that the images are
perfectly registered and that all epipolar lines are horizontal. Potential matches are allowed to occur between zero
crossings of the same sign on corresponding epipolar lines.
Note that this implements the compatibility
constraint
[6].
For D disparity values ranging from d; to d,, we computi!
the set of potential matches in the following way:
Allocate
a field P = (paddr, D) to contain the set of
potential
matches.
Initialize P to contain zero everywhere.
Allocate two 2-bit fields, L and R, initialized
the zero crossings
of the left and right images.
to contain
While holding L stationary,
“slide” R horizontally
one
pixel at a time along the x-axis of the NEWS
grid, from
x = d; to x = df.
After the ith shift, write a I into the
field ((paddr i- i), 1) at each (x, y) where L and R contain
identical zero crossings.
For example, in the third step, after the first shift of R, the
would be 1 at every point (x, y) where
AI LANGUAGES AND ARCHITECTURES / 749
field P with a three-dimensional kernel that gathers support from locally smooth disparity configurations.
There
are many different kernels, or support functions,
that will
do a good job on this task. Reference [6] uses a very simple
support function (or “excitatory region”) that is circular,
uniformly-weighted, and flat, i.e., it occupies only one level
in the disparity dimension. More elaborate, 3-D support
functions are described in [9] and [12]. It should be noted
that these algorithms do not perform a simple linear convolution. Prazdny’s algorithm, for example, includes a nonlinear step designed to ignore irrelevant matches and cut
down on computational costs [12].
Three-dimensional convolutions are computed in a manner similar to two-dimensional convolutions.
In the 3-D
case, however, a memory location in each processor might
accumulate values not only from neighbors in the x and y
dimensions, but also in the memory dimension.
.4
Figure 3. Diagram describing how the geometry of stereomatching is mapped into the Connection Machine com-
puter. The 1-D situations (as in Figure 2) are “stacked”
in the y direction to form a complete 2-D stereomatching
problem.
After this operation, the field P represents a rectangular
block of z-y-d space with some configuration of matches
(l’s) embedded in it.
3.2.1
Image
registration
As stated so far. this algorithm assumes that the stereo
images are perfectly registered with respect to the epipolar
lines. In nractice. of course. this is rarelv the case. In our
implementation. we first “undistort” the images to compensatk for perspective distortion and camera-misalignment.
The nositional error of each pixel is measured using a semiautomatic svstem based on a test nattern which, rn effect,
produces a *stereo pair with no false matches, Each pixel
is then “sent” to its corrected position via the hype&be
communication mechanism.
Due to rounding-off of pixel displacements, it is inevitable that more than one pixel will collide at the same destination pixel. We take the average of the colliding pixels
as the value of the destination.
It is very convenient to
use the router for this computation, since it automatically
combines colliding messages with a user-specified “combining function,” such as MAX, MIN, LOGIOR,
etc. In our
case. the combining function is ADD. The destination pixel
is normalized acco:ding to the number of pixels that collide
there.
I
3.3
Gathering
I
local
Three-dimensional
support
convolution
A straightforward way to measure how well each disparity satisfies the smoothness condition is to convolve the
three-dimensional
region of x-y-d space contained by the
750 / ENGINEERING
uniqueness
The uniqueness constraint
[6] allows a left image feature
to be matched with only one right image feature and vice
versa. Every working stereo algorithm uses the uniqueness
constraint or something similar to it. It expresses the fact
that under normal circumstances a single physical object
does not simultaneously give rise to a single feature in one
image and many features in another image.
Figure 2 and its caption illustrate the uniqueness constraint. In the simple algorithm which we are now describing, potential matches are retained if they have the maximum local support score along the radial lines projecting
from each eye. This process of non-maximum
suppression
along lines of sight has been called the winner-take-all
approach; it is analyzed in detail in [14]. It is used, with
slight variations, by the algorithms in [9], [12] and [14], and
it is similar to the inhibition employed by the cooperative
algorithm in [6].
I
Our first step at distinguishing the correct matches from
the false ones is to apply a continuity or smoothness
constraint. Many algorithms based on such constraints have
been developed [6] [9] [lo] [ll] [12].
3.3.1
Enforcing
4
4.1
A new
algorithm
combining
and ordering
conuniqueness
straints
The
forbidden
zone
Every potential match is surrounded by an hourglass-shaped
region extending through the d and x dimensions, as shown
in Figure 4. This region is called the forbidden
zone, see
[13]. Any straight 1ine lying in the forbidden zone must
intersect no more than one match, unless the scene contains transparent or narrow occluding objects. Examples
of such a scene include a pane of glass with markings on
both surfaces or a vertical wire suspended in front of a textured wall. These situations can give rise to violations of
the ordering constraint.
Assuming that the scene contains none of the situations
just described, any surviving match must be unique not
only along the left and right eye radii (Li and L, in Figures 2 and 4), but along any line situated between them,
such as L in Figure 4. The set of all such lines fills the
forbidden zone completely. Therefore, we implemented an
algorithm in which a potential match is eliminated unless its
local support score is greater than that of any other match
in its entire forbidden
zone.
If there are D disparity levels, the forbidden zone sur-
rounding each potential match contains approximately
other potential matches. Therefore, the a priori time
complexity of an algorithm that considers every score in ev-
D2/2
T
R
.
Figure 4. The forbidden zone. Enforcing uniqueness in
the directions of Li and L, in this diagram corresponds to
allowing only one match per image feature (recall Figure
2). If we assume that the scene contains opaque objects
and no narrow occluding objects, then a straight line lying
inside the forbidden zone, such as L above, must also
contain at most one match.
Consideration of all such
lines implies that every correct match must be the only
match in its own forbidden zone, The forbidden zones
of a few matches are shown above (shaded). Note that
none of the black dots hypothetical correct matches) has
another black dot insi e its forbidden zone.
ery forbidden zone is O(D3). However, an O(D2)
exists, which we now describe.
B’s
Forbidden
Zone
A'S
Forbidden
Zone
Figure 5. Algorithm for non-maximum suppression over
the entire forbidden zone (see text). LI and L, (from Figures 2 and 4) are redrawn here to make the relationship
between this figure and Figure 4 explicit. Note, however,
that the line L, is tilted 45 degrees. This is a consequence of the way the field P was constructed in section
3.2. In particular, lines parallel to Li lie inside a single
processor’s memory, but lines parallel to L, are oriented
as shown.
algorithm
shading have already been examined (by A). In
this way, the time complexity of the foribdden zone computation can be kept down to O(D2). (Note that a similar
“downward pass” is necessary to cover the upper lobes.)
horizontal
4.1.1
An O(D2)
suppression
zone.
algorithm
for non-maximum
over
the
entire
forbidden
Figure 5 shows a slice of the field P, through the x-memory
plane, in the neighborhood of a single processor.
Figure
5 is equivalent to Figure 4, but it makes the relationship
between Figure 4 and the Connection Machine architecture more explicit. Notice that here the forbidden zone is
“skewed.” This is a consequence of the way the field P was
constructed in section 3.2. In particular, a vertical line in
Figure 4 maps into a vertical line in Figure 5, but a horizontal line in Figure 4 maps into a diagonal line in Figure
5.
In our algorithm, a potential match must examine the
local-supporr scores of every potential match in its forbidden zone. The Connection Machine implementation
steps
through each disparity level i, first up (i = di, . . . . df) then
down (; = d , . . . . d;). On the upward pass the lower “lobes”
of the forbi d den zones are considered. For example, in Figure 5, the match A checks whether its score is greater than
all scores in the horizontally cross-hatched lobe below it.
If this is not the case, then A is disqualified. Next, the
match B checks whether its score is greater than all scores
in the diagonally cross-hatched lobe below it. If this is not
the case, then B is disqualified. Note, however, that the
maximum value found in the horizontally-shaded lobe can
be cached and used to help compute the maximum in the
diagonally-shaded lobe. In particular, in order to compute
the maximum value in the entire diagonally-shaded lobe, B
needs to examine only the scores covered by diagonal shading alone, because the scores covered by both diagonal and
5
Results
and discussion
Some results of running our algorithm on natural and synthetic images are shown in Figures 6 through 10.
5.1
Time
complexity
of
the
algorithm
the efficient implementation of the forbidden-zone
computation described in the previous section, the most
time-consuming component of the entire algorithm is the
local support step, which involves an expensive 3-D convolution. This operation requires time proportional to the
number of disparity levels being investigated.
Therefore,
for a particular local-support function, the time complexity of the entire algorithm is roughly O(D) .
Given
5.2
Using
3-D
support
functions
References [9] and [12 describe algorithms that are based
on the winner-take-al i approach and which use elaborate
support functions. These functions are circularly symmetric in the x-y plane, with a butterfly-shaped cross-section.
The values of the function decrease gradually from a nonzero weight at the center to zero at the extreme perimeter.
Such a function is designed to respond to a configuration
of matches that is locally smooth and roughly planar, and
which may have a nonzero disparity gradient [9].
AI LANGUAGES AND ARCHITECTURES / 75 1
The Connection Machine implementation allows the use
of such 3-D support functions, but the best results we have
obtained so far have been with simple 2-D kernels. We
intend to perform further research on this topic.
5.2.1
Color
tures
vectors
and
other
matching
fea-
It is possible to combine information from various color
channels to improve stereomatching results. One method
(SOC)
that we have tried is to use the sign of convolution
as a matching primitive. This was used by Nishihara in the
PRISM stereomatching system [8].
Our approach was to compute the SOC for each of three
color channels, then load them into separate positions in a
S-bit field of “SOC color vectors.” These vectors were used
instead of the 2-bit zero crossings to compute the potential
matches. This was found to give a noticeable improvement
for very contrived scenes. For example, we ran such an algorithm on a scene containing a matte white hammer on a
matte white background, with a randomly colored random
dot stereogram
projected onto the objects to provide a rich
texture for matching. This technique, called unstructured
light, was invented by Nishihara (81; he used it for a single broad color channel. We noticed a severe drop in the
number of matches and a roughly proportional drop in the
number of errors. The method offered little or no improvement for typical natural scenes. We do not regard these
results as conclusive; rather, we mention them in order to
stimulate interest in the use of color in stereomatching.
6
Conclusions
Stereomatching can be performed extremely fast on a massively parallel processor such as the Connection Machine
computer. The use of this machine also helps us represent
the problem easily, since the geometry of the stereomatching situation naturally maps into such a parallel architecture.
The Connection Machine computer has been used to
implement an efficient new algorithm, winner-take-all
using the entire forbidden
zone. The new algorithm exploits
uniqueness and ordering constraints more fully than previous similar algorithms.
The tremendous speed afforded by the Connection Machine computer makes it possible to experiment with sophisticated computer vision algorithms, such as the stereomatching algorithm described here, interactively.
7
Figure 6. A natural stereo pair. The scene consisted
of a terrain model approximately 1 meter wide, with a
simulated building added.
Figure 7. Contour map for the natural stereo pair. The
disparities were computed using the simple version of algorithm, i.e., with non-maximum suppression only in the
directions of Ll and L, (from Figure 2). The algorithm
was run over a disparity range of 23 prxels; the support
region was a flat square 23 pixels on a side. Computation time for the stereomatching algorithm (not including
edge detection was 0.95 seconds. The contour map was
computed by drawing isodisparity lines after interpolating the disparity field. (The interpolation algorithm used
a “rubber sheet” model. This is basically an iterative
solution to the heat equation., performing approximately
1000 iterations of nearest-neighbor averaging at 20 bits
of precision and with known disparities held fixed, followed by a slight gaussian smoothing, all computed in
1.5 seconds).
Acknowledgments
The author is indebted to T. Poggio for his guidance in
this work. Many of the ideas in this paper originated in
discussions with him.
Connection Machine is a trademark of Thinking Machines Corporation.
Figure 8. Another contour map for the natural stereo
pair, using
the full-forbidden-zone
algorithm.
All other
parameters are the same as in Figure 7. Note that drastic
errors (such as the peaks and erratic elevations appearing
in Figure 7) are almost non-existent in this contour map.
752
/ ENGINEERING
[lo] Ohta, Yuichi and Kanade, Takeo. “Stereo by Intraand Inter-scanline Search Using Dynamic Programming,”
Carnegie-Mellon
University
Technical Report CMU-CS-83162, 1983.
[ll] Baker, H. H. and Binford T. 0. “Depth from Edge
and Intensity Based Stereo,” Seventh International
Joint
Conference
on Artificial Intelligence,
August 1981, pp. 631636.
[121 Prazdny,
ological
Figure 9. A computer-generated
stereo pair. The scene
consisted of a vase in front of a textured backdrop.
K. “Detection of Binocular
Cybernetics,
A
pp.93-99,
Disparities,”
Bi-
1985.
[13] Yuille, Alan L., and Poggio,
Tomaso. “A Generalized
Ordering Constraint for Stereo Correspondence,”
M. I. T.
A-1. Memo
777, Cambridge, MA, May 1984.
[141Marroquin,
1~
52,
M.I. T. A.I.
Lab
[15] Marr,
125, 1982.
D.
1983.
Jose L. “Design of Cooperative Networks,”
Paper 255, Cambridge, MA July
Working
Vision,
Freeman,
San Franscisco,
pp.lll-
C
B
Figure 10. (A) s h ows the occluded region for the synthetic stereo pair, where no matches should be found.
(B) shows the locations where matches were found using
the simple algorithm. (C) shows the locations of matches
found using the full-forbidden-zone
algorithm. Note that
the full-forbidden-zone
algorithm was more successful at
eliminating matches in the occluded region, where the
ordering constraint is violated.
REFERENCES
[I] Canny, John F. “Finding Lines and Edges in Images,”
M.I.T.
A.I.
Memo
720,
1983.
[2] Drumheller, Michael and Poggio, Tomaso. “On Parallel Stereo,”
1986
IEEE
International
Conference
on
April 1986, pp. 1439 1448.
Robotics and Automation,
[3] Grimson, W. Eric L. “From Images to Surfaces,” M.I.T.
Press, Cambridge, MA, 1981.
[4] Hillis, W. Daniel.
The Connection
Press, Cambridge, MA 1985.
Machine,
M.I.T.
[5] Mur,
D. and Hildreth, E. “Theory of Edge Detection,” Proc. Roy. Sot. London, vol. B 207, pp.187-217,
1980.
[6] Marr, D. and Poggio,
T. “Cooperative computation
stereo disparity,” Science 194, pp.283-287,
1976.
of
[7] Mayhew, J.E.W. and Frisby, J.P. “Psychophysical and
computational studies towards a theory of human stereopsis,” Artificial Intelligence
17 (1981), pp.349-385.
[8] Nishihara, Keith. “PRISM: A practical real-time imaging stereo matcher,” M.I. T. A.I. Memo 780, Cambridge,
MA, May 1984.
[9] Pollard, S. B., Porrill, J., Mayhew, J. E. W. and
Frisby, J. P. “Disparity Gradient, Lipschitz Continutity,
and Computing Binocular Correspondences,” Artificial Intelligence
Vision Research
Unit AIVRU
ref. no. 010,
University of Sheffield, England, 1985.
AI LANGUAGES
AND ARCHITECTURES
/ 753

