On The Assimilation Of AMSU Raw Radiances Over Land at Météo-France
advertisement
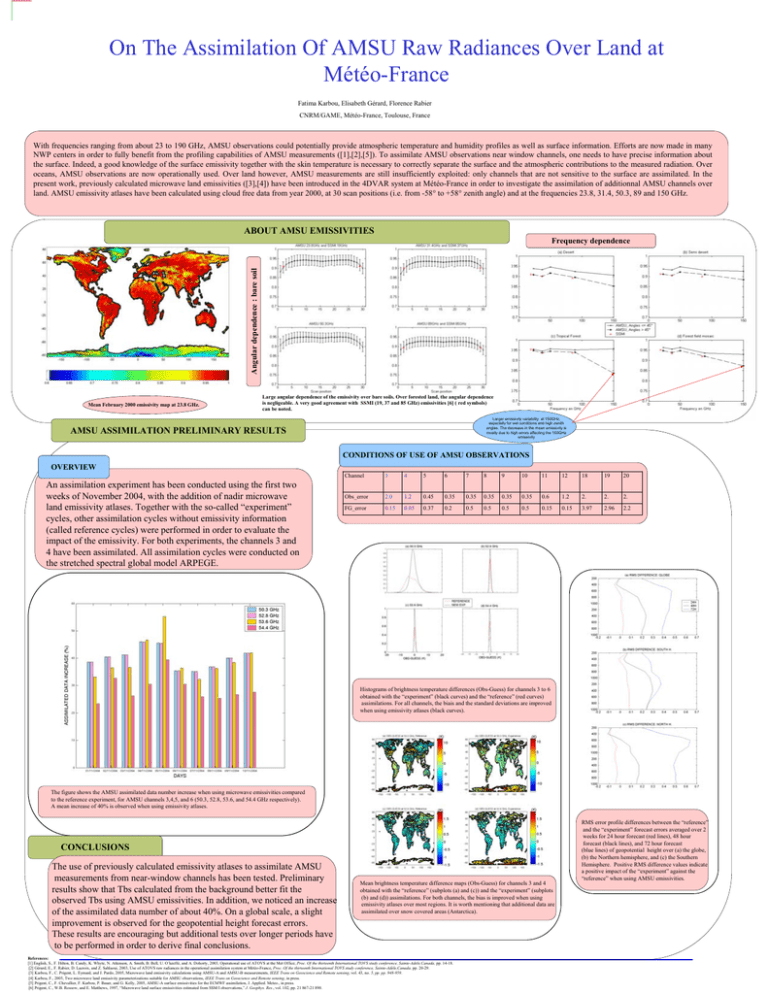
On The Assimilation Of AMSU Raw Radiances Over Land at Météo-France Fatima Karbou, Elisabeth Gérard, Florence Rabier CNRM/GAME, Météo-France, Toulouse, France With frequencies ranging from about 23 to 190 GHz, AMSU observations could potentially provide atmospheric temperature and humidity profiles as well as surface information. Efforts are now made in many NWP centers in order to fully benefit from the profiling capabilities of AMSU measurements ([1],[2],[5]). To assimilate AMSU observations near window channels, one needs to have precise information about the surface. Indeed, a good knowledge of the surface emissivity together with the skin temperature is necessary to correctly separate the surface and the atmospheric contributions to the measured radiation. Over oceans, AMSU observations are now operationally used. Over land however, AMSU measurements are still insufficiently exploited: only channels that are not sensitive to the surface are assimilated. In the present work, previously calculated microwave land emissivities ([3],[4]) have been introduced in the 4DVAR system at Météo-France in order to investigate the assimilation of additionnal AMSU channels over land. AMSU emissivity atlases have been calculated using cloud free data from year 2000, at 30 scan positions (i.e. from -58° to +58° zenith angle) and at the frequencies 23.8, 31.4, 50.3, 89 and 150 GHz. ABOUT AMSU EMISSIVITIES Angular dependence : bare soil Frequency dependence Mean February 2000 emissivity map at 23.8 GHz. Large angular dependence of the emissivity over bare soils. Over forested land, the angular dependence is negligeable. A very good agreement with SSMI (19, 37 and 85 GHz) emissivities [6] ( red symbols) can be noted. Larger emissivity variability at 150GHz, especially for wet conditions and high zenith angles. The decrease in the mean emissivity is mostly due to high errors affecting the 150GHz emissivity AMSU ASSIMILATION PRELIMINARY RESULTS CONDITIONS OF USE OF AMSU OBSERVATIONS OVERVIEW An assimilation experiment has been conducted using the first two weeks of November 2004, with the addition of nadir microwave land emissivity atlases. Together with the so-called “experiment” cycles, other assimilation cycles without emissivity information (called reference cycles) were performed in order to evaluate the impact of the emissivity. For both experiments, the channels 3 and 4 have been assimilated. All assimilation cycles were conducted on the stretched spectral global model ARPEGE. Channel 3 4 5 6 7 8 9 10 11 12 18 19 20 Obs_error 2.0 1.2 0.45 0.35 0.35 0.35 0.35 0.35 0.6 1.2 2. 2. 2. FG_error 0.15 0.05 0.37 0.2 0.5 0.5 0.5 0.5 0.15 0.15 3.97 2.96 2.2 Histograms of brightness temperature differences (Obs-Guess) for channels 3 to 6 obtained with the “experiment” (black curves) and the “reference” (red curves) assimilations. For all channels, the biais and the standard deviations are improved when using emissivity atlases (black curves). The figure shows the AMSU assimilated data number increase when using microwave emissivities compared to the reference experiment, for AMSU channels 3,4,5, and 6 (50.3, 52.8, 53.6, and 54.4 GHz respectively). A mean increase of 40% is observed when using emissivity atlases. RMS error profile differences between the “reference” and the “experiment” forecast errors averaged over 2 weeks for 24 hour forecast (red lines), 48 hour forecast (black lines), and 72 hour forecast (blue lines) of geopotential height over (a) the globe, (b) the Northern hemisphere, and (c) the Southern Hemisphere. Positive RMS difference values indicate a positive impact of the “experiment” against the “reference” when using AMSU emissivities. CONCLUSIONS The use of previously calculated emissivity atlases to assimilate AMSU measurements from near-window channels has been tested. Preliminary results show that Tbs calculated from the background better fit the observed Tbs using AMSU emissivities. In addition, we noticed an increase of the assimilated data number of about 40%. On a global scale, a slight improvement is observed for the geopotential height forecast errors. These results are encouraging but additional tests over longer periods have to be performed in order to derive final conclusions. Mean brightness temperature difference maps (Obs-Guess) for channels 3 and 4 obtained with the “reference” (subplots (a) and (c)) and the “experiment” (subplots (b) and (d)) assimilations. For both channels, the bias is improved when using emissivity atlases over most regions. It is worth mentioning that additional data are assimilated over snow covered areas (Antarctica). References: [1] English, S., F. Hilton, B. Candy, K. Whyte, N. Atkinson, A. Smith, B. Bell, U. O’keeffe, and A. Dohorty, 2003, Operational use of ATOVS at the Met Office, Proc. Of the thirteenth International TOVS study conference, Sainte-Adèle,Canada, pp. 14-18. -[2] Gérard, E., F. Rabier, D. Lacroix, and Z. Sahlaoui, 2003, Use of ATOVS raw radiances in the operational assimilation system at Météo-France, Proc. Of the thirteenth International TOVS study conference, Sainte-Adèle,Canada, pp. 20-29. -[3] Karbou, F., C. Prigent, L. Eymard, and J. Pardo, 2005, Microwave land emissivity calculations using AMSU-A and AMSU-B measurements, IEEE Trans on Geoscience and Remote sensing, vol. 43, no. 5, pp. pp. 948-959. -[4] Karbou, F., 2005, Two microwave land emissivity parameterizations suitable for AMSU observations, IEEE Trans on Geoscience and Remote sensing, in press. -[5] Prigent, C., F. Chevallier, F. Karbou, P. Bauer, and G. Kelly, 2005, AMSU-A surface emissivities for the ECMWF assimilation, J. Applied. Meteo., in press. -[6] Prigent, C., W.B. Rossow, and E. Matthews, 1997, “Microwave land surface emissivities estimated from SSM/I observations,” J. Geophys. Res., vol. 102, pp. 21 867-21 890.
