Problem Set 3 1 Circadian Clocks (30 points)
advertisement
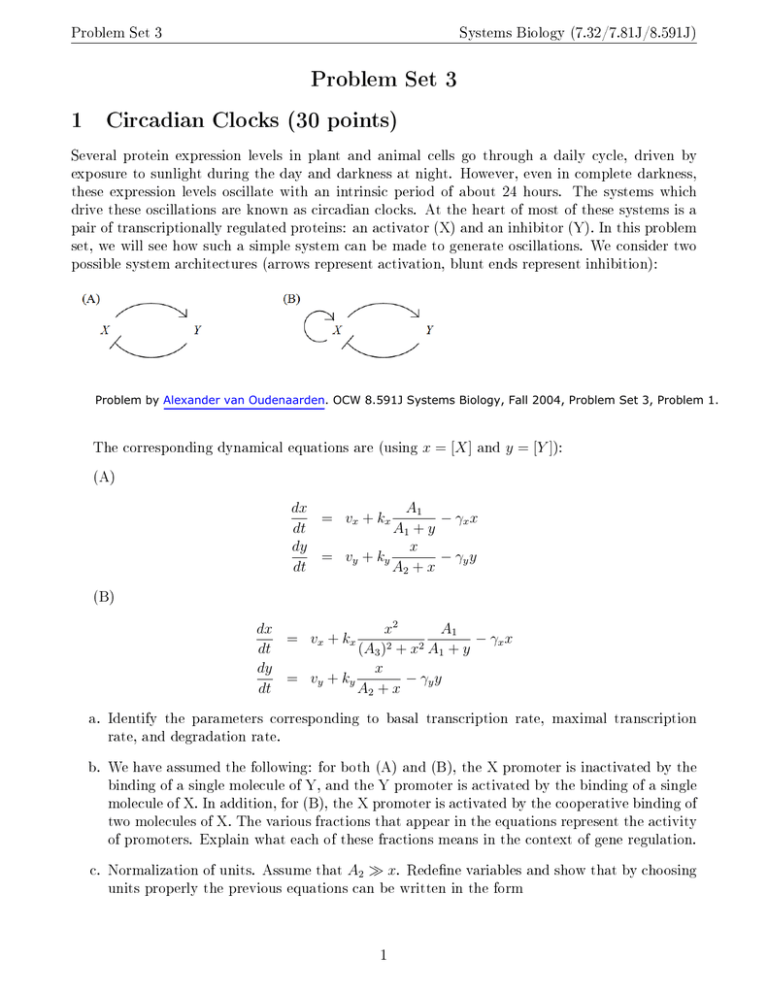
Problem Set 3 Systems Biology (7.32/7.81J/8.591J) Problem Set 3 1 Circadian Clocks (30 points) Several protein expression levels in plant and animal cells go through a daily cycle, driven by exposure to sunlight during the day and darkness at night. However, even in complete darkness, these expression levels oscillate with an intrinsic period of about 24 hours. The systems which drive these oscillations are known as circadian clocks. At the heart of most of these systems is a pair of transcriptionally regulated proteins: an activator (X) and an inhibitor (Y). In this problem set, we will see how such a simple system can be made to generate oscillations. \e consider two possible system architectures (arrows represent activation, blunt ends represent inhibition): Problem by Alexander van Oudenaarden. OCW 8.591J Systems Biology, Fall 2004, Problem Set 3, Problem 1. The corresponding dynamical equations are (using x = [X] and y = [Y ]): (A) dx A1 = vx + kx − γx x dt A1 + y dy x = vy + ky − γy y dt A2 + x (B) A1 dx x2 = vx + kx − γx x 2 2 dt (A3 ) + x A1 + y dy x = vy + ky − γy y dt A2 + x a. Identify the parameters corresponding to basal transcription rate, maximal transcription rate, and degradation rate. b. \e have assumed the following: for both (A) and (B), the X promoter is inactivated by the binding of a single molecule of Y, and the Y promoter is activated by the binding of a single molecule of X. In addition, for (B), the X promoter is activated by the cooperative binding of two molecules of X. The various fractions that appear in the equations represent the activity of promoters. Explain what each of these fractions means in the context of gene regulation. c. Normalization of units. Assume that A2 » x. Redefne variables and show that by choosing units properly the previous equations can be written in the form 1 Problem Set 3 Systems Biology (7.32/7.81J/8.591J) (A) dx̄ 1 − x̄) = γ¯x (v¯x + k¯x dt̄ 1 + ȳ dȳ = v¯y + k̄y x̄ − ȳ dt̄ (B) dx̄ x̄2 1 − x̄) = γ¯x (v¯x + k¯x 2 dt̄ 1 + x̄ 1 + ȳ dȳ = v¯y + k̄y x̄ − ȳ dt̄ From now on we will work with the simplifed equations, dropping the bars on the variable and paramter symbols. These equations are of the general form dx = f (x, y) dt dy = g(x, y) dt Let (x0 , y0 ) be a fxed point of the system (f (x0 , y0 ) = 0, g(x0 , y0 ) = 0) and recall that if we defne A= ∂f ∂x ∂g ∂x ∂f ∂y ∂g ∂y |x0, y0 fxed points of this two dimensional system are stable if and only if T r(A) < 0 and Det(A) > 0. d. For systems (A) and (B) separately, assume vx = 0.1, vy = 0.0, kx = 4.0, ky = 2.0 and γx = 10 and plot the nullclines f (x, y) = 0 and g(x, y) = 0 on the y vs. x phase plane. Draw the vector feld indicating the direction of motion in diferent regions of the plane and, based on the graphs, comment on the stability of the fxed point. COMPUTATION e. For system (A), prove that the system will always converge to a stable fxed point. f. For system (B), 1. Assume vx = 0.1, vy = 0.0, kx = 4.0, ky = 2.0 and let γx be a variable parameter. Find the fxed point of the system. If this fxed point becomes unstable oscillations will arise. By numerically analyzing T r(A) and Det(A) as a function of γx write down the conditions on γx under which the system is oscillatory. \hat does this condition mean in terms of the timescale of X and Y? 2. Solve the equations numerically using the parameters given in (f1). Choose two diferent values of γx , in one case the system shows sustained oscillations, while in the other case the system approaches a stable fxed point. COMPUTATION 2 Problem Set 3 3. Systems Biology (7.32/7.81J/8.591J) By varying γx , we can tune the period of the oscillator. How much does the amplitude of oscillations change? \hat would you expect in the case of a repressilator? Interprete your results and comment on the tunability1 of an oscillator. 4. System (B) is a network motif found in many biological oscillatory systems (Uri Alon's book, Chapter 6.5). Look up in the literature for an example. 2 COMPUTATION Deterministic scale-free networks2 (15 points) In this problem you will study the degree distribution and clustering properties of deterministic scale-free networks. Consider the following procedure of generating a deterministic network: • t = −1 Start from a single edge connecting two nodes. • t = 0 Add one more node, and connect it to the two existing nodes. ... • t = n For every edge of the graph add a new node and connect it to the nodes of the corresponding edge. © American Physical Society. All rights reserved. This content is excluded from our Creative Commons license. For more information, see http://ocw.mit.edu/help/faq-fair-use/. a. Are preferential attachment and/or growth incorporated into this model? b. How many nodes are added at t = n? \hat are the degrees k of these nodes? c. How does the degree k of the node change over time? d. The clustering coefcient of the node3 C depends on the degree of the node in a scale-free manner: C(k) ' k −β . Find β by deriving the rule of how the clustering coefcient of the node changes over time and using the result of part (c). I Tsai et al. Robust, Tunable Biological Oscillations from Interlinked Positive and Negative Feedback Loops. Science, 321, 126-129 (2008) 2 SN Dorogovtsev et al. Pseudofractal scale-free web. Physical Review E, 65, 066122 (2002) 3 The defnition of the clustering coefcient can be found on p.259 of Alon's book. 3 Problem Set 3 Systems Biology (7.32/7.81J/8.591J) e. One can design a scale-free network with β = 0. \hich properties of the network discussed in this problem make β nonzero? f. \hile k in this problem can only have discrete values, for this part of the problem we will work in the continuous limit. Thus, the probability that a given node has degree k ∈ [k0 , k0 +δ(k0 )] can be written as P (k0 ≤ k < k0 + δ(k0 )) = ρ(k0 )δ(k0 ) where probability density of the degree distribution of the nodes, ρ(k), is proportional to k −γ . Find γ by counting the number of nodes with the degree k . (Hint : don't forget that δ is a function of k.) Does γ depend on time? 3 Network Motifs in Transcription Networks (5 points) For the transcription networks of E.coli and S.cerevisiae, there is one three-node network motif and one four-node network motif, namely FFL and Bi-fan. On p.120 of Uri Alon's book, you can fnd data for the two real networks. a. Please calculate the expected number of appearances of FFL and Bi-fan in E-R networks that have the same number of nodes and edges as the two real networks. b. Compare your results with Nrand listed in the table, which corresponds to the appearance of each subgraph in a degree-preserving random network. 4 MIT OpenCourseWare http://ocw.mit.edu 8.591J / 7.81J / 7.32 Systems Biology Fall 2014 For information about citing these materials or our Terms of Use, visit: http://ocw.mit.edu/terms.

