The comparison of vertical interpolation methods Introduction
advertisement
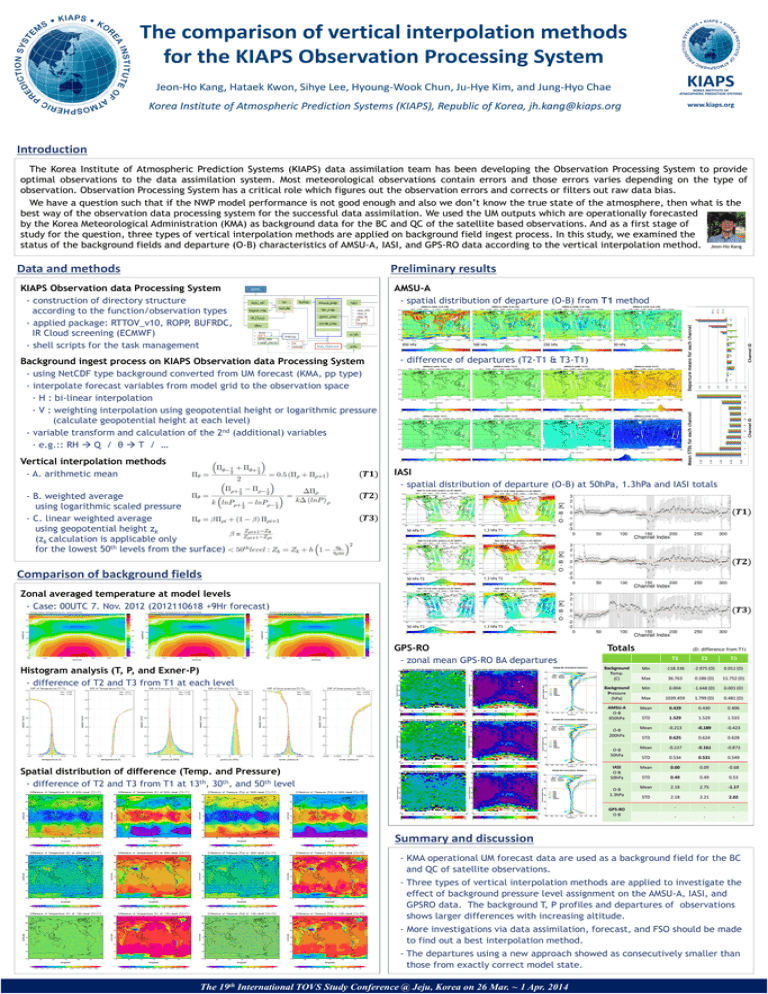
The comparison of vertical interpolation methods for the KIAPS Observation Processing System KIAPS Jeon-Ho Kang, Hataek Kwon, Sihye Lee, Hyoung-Wook Chun, Ju-Hye Kim, and Jung-Hyo Chae KOREA INSTITUTE OF ATMOSPHERIC PREDICTION SYSTEMS Korea Institute of Atmospheric Prediction Systems (KIAPS), Republic of Korea, jh.kang@kiaps.org www.kiaps.org Introduction The Korea Institute of Atmospheric Prediction Systems (KIAPS) data assimilation team has been developing the Observation Processing System to provide optimal observations to the data assimilation system. Most meteorological observations contain errors and those errors varies depending on the type of observation. Observation Processing System has a critical role which figures out the observation errors and corrects or filters out raw data bias. We have a question such that if the NWP model performance is not good enough and also we don’t know the true state of the atmosphere, then what is the best way of the observation data processing system for the successful data assimilation. We used the UM outputs which are operationally forecasted by the Korea Meteorological Administration (KMA) as background data for the BC and QC of the satellite based observations. And as a first stage of study for the question, three types of vertical interpolation methods are applied on background field ingest process. In this study, we examined the status of the background fields and departure (O-B) characteristics of AMSU-A, IASI, and GPS-RO data according to the vertical interpolation method. Jeon-Ho Kang Data and methods Preliminary results AMSU-A - spatial distribution of departure (O-B) from T1 method Vertical interpolation methods - A. arithmetic mean - B. weighted average using logarithmic scaled pressure - C. linear weighted average using geopotential height zk (zk calculation is applicable only for the lowest 50th levels from the surface) Comparison of background fields (𝑻𝑻) 250 hPa 50 hPa - difference of departures (T2-T1 & T3-T1) Channel ID Mean STDs for each channel Background ingest process on KIAPS Observation data Processing System - using NetCDF type background converted from UM forecast (KMA, pp type) - interpolate forecast variables from model grid to the observation space · H : bi-linear interpolation · V : weighting interpolation using geopotential height or logarithmic pressure (calculate geopotential height at each level) - variable transform and calculation of the 2nd (additional) variables · e.g.:: RH Q / θ T / … 500 hPa Channel ID 850 hPa Departure means for each channel KIAPS Observation data Processing System - construction of directory structure according to the function/observation types - applied package: RTTOV_v10, ROPP, BUFRDC, IR Cloud screening (ECMWF) - shell scripts for the task management IASI - spatial distribution of departure (O-B) at 50hPa, 1.3hPa and IASI totals (𝑻𝑻) (𝑻𝑻) 50 hPa T1 50 hPa T2 (𝑻𝑻) 1.3 hPa T1 (𝑻𝑻) 1.3 hPa T2 Zonal averaged temperature at model levels - Case: 00UTC 7. Nov. 2012 (2012110618 +9Hr forecast) 50 hPa T3 Histogram analysis (T, P, and Exner-P) - difference of T2 and T3 from T1 at each level (𝑻𝑻) 1.3 hPa T3 GPS-RO - zonal mean GPS-RO BA departures Totals Background Temp. (C) Background Pressure (hPa) AMSU-A O-B 850hPa O-B 200hPa O-B 50hPa IASI O-B 50hPa Spatial distribution of difference (Temp. and Pressure) - difference of T2 and T3 from T1 at 13th, 30th, and 50th level O-B 1.3hPa GPS-RO O-B (D: difference from T1) T1 T2 T3 Min -118.336 -2.975 (D) 0.011 (D) Max 36.763 0.186 (D) 11.752 (D) Min 0.004 -1.648 (D) 0.001 (D) Max 1039.459 1.799 (D) 0.481 (D) Mean 0.429 0.430 0.406 STD 1.529 1.529 1.533 Mean -0.213 -0.189 -0.423 STD 0.625 0.624 0.628 Mean -0.237 -0.161 -0.873 STD 0.534 0.531 0.549 Mean 0.00 0.09 -0.68 STD 0.49 0.49 0.53 Mean 2.19 2.75 -1.17 STD 2.18 2.21 2.02 - - - - - - Summary and discussion - KMA operational UM forecast data are used as a background field for the BC and QC of satellite observations. - Three types of vertical interpolation methods are applied to investigate the effect of background pressure level assignment on the AMSU-A, IASI, and GPSRO data. The background T, P profiles and departures of observations shows larger differences with increasing altitude. - More investigations via data assimilation, forecast, and FSO should be made to find out a best interpolation method. - The departures using a new approach showed as consecutively smaller than those from exactly correct model state. The 19th International TOVS Study Conference @ Jeju, Korea on 26 Mar. ~ 1 Apr. 2014
