Web-based Skew-T displays of GOES and POES operational
Web-based Skew-T displays of GOES and POES operational atmospheric soundings added to the NOAA/NESDIS Operation
A.K. Sharma
NOAA/NESDIS Office of Satellite Data Processing and Distribution – OSDPD
NOAA/NESDIS provides vertical atmospheric profiles of temperature and moisture soundings derived from Geostationary Operational Environmental Satellites (GOES) and Advanced TIROS (Television and Infrared Observation Satellite) Operational Vertical Sounding (ATOVS) systems onboard Polar Orbiting Environmental Satellites (POES). GOES sensors are aboard GOES-11 (West) and GOES-12 (East) and ATOVS sensors are aboard the NOAA-15, NOAA-18 and 19 series of POES and the European Meteorological Operational satellite (MetOpoperational GOES and POES sounder and imager products being generated. In order to provide a means of evaluating GOES and POES Soundings McIDAS (Man computer Interactive Data Access System) Meteorological Data (MD) files via the Web, the OSDPD has been producing hourly SKEW-T diagrams for over 450 sites across the U.S., Mexico, Caribbean, Western Atlantic, Eastern Pacific, and Southern Canada (including 24 hr archive) from GOES Soundings MD files. In order to leverage off the GOES capability and associated software, the OSDPD has developed POES sounder SKEW-T web pages that compliment the GOES pages over the globe. There have been significant changes in the operational system due to system upgrades, algorithm updates, and value added data products and services. User requirements for data products and services for sounders like ATOVS and IASI would help us determine the products and services required from the next generation of sounders such as Cross-Track Infrared Sounder/ Advanced Technology Microwave Sounder (Cris/ATMS) as planned for the National Polar-orbiting Operational Environmental Satellite System (NPOESS) program and the future missions of the European Organization for the Exploitation of Meteorological (EUMSAT) and GOES-R satellites. This presentation will include the discussion on the NOAA/NESDIS Environmental Satellites Processing Center (ESPC) system architecture involving sounding data processing and distribution, improvements made for data quality measurements, and web-pages for soundings products. This will also include the software developed for generating GOES and POES SKEW-T diagrams and display them via the Web site of Satellite Services Division.
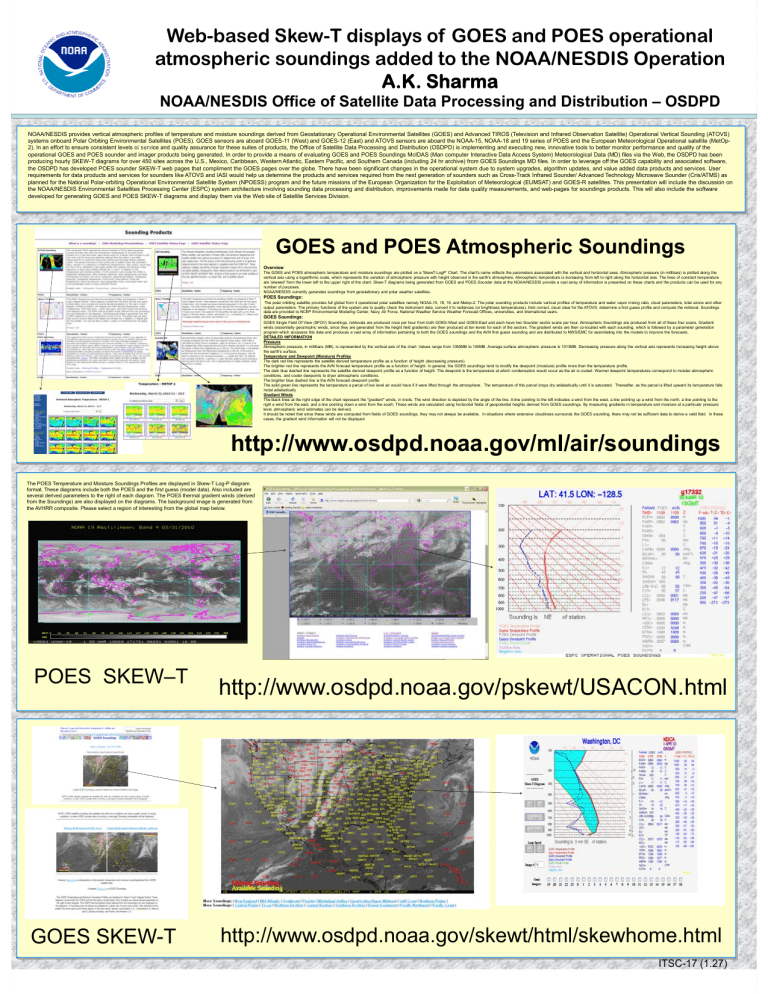
GOES and POES Atmospheric Soundings
Overview
The GOES and POES atmospheric temperature and moisture soundings are plotted on a 'SkewT-LogP' Chart. The chart's name reflects the parameters associated with the vertical and horizontal axes. Atmospheric pressure (in millibars) is plotted along the vertical axis using a logarithmic scale, which represents the variation of atmospheric pressure with height observed in the earth's atmosphere. Atmospheric temperature is increasing from left to right along the horizontal axis. The lines of constant temperature are 'skewed' from the lower left to the upper right of the chart. Skew-T diagrams being generated from GOES and POES Sounder data at the NOAA/NESDIS provide a vast array of information is presented on these charts and the products can be used for any number of purposes.
NOAA/NESDIS currently generates soundings from geostationary and polar weather satellites.
POES Soundings:
The polar orbiting satellite provides full global from 4 operational polar satellites namely NOAA-15, 18, 19, and Metop-2. The polar sounding products include vertical profiles of temperature and water vapor mixing ratio, cloud parameters, total ozone and other output parameters. The primary functions of the system are to quality check the instrument data, convert it to radiances (or brightness temperatures), limb correct, cloud clear for the ATOVS, determine a first guess profile and compute the retrieval. Soundings data are provided to NCEP Environmental Modeling Center, Navy, Air Force, National Weather Service Weather Forecast Offices, universities, and international users.
GOES Soundings:
GOES Single Field Of View (SFOV) Soundings, retrievals are produced once per hour from both GOES-West and GOES-East and each have two Sounder sector scans per hour. Atmospheric Soundings are produced from all of these four scans. Gradient winds (essentially geostrophic winds, since they are generated from the height field gradients) are then produced at ten levels for each of the sectors. The gradient winds are then co-located with each sounding, which is followed by a parameter generation program which accesses this data and produces a vast array of information pertaining to both the GOES soundings and the AVN first guess sounding and are distributed to NWS/EMC for assimilating into the models to improve the forecasts.
DETAILED INFORMATION
Pressure
Atmospheric pressure, in millibars (MB), is represented by the vertical axis of the chart. Values range from 1050MB to 100MB. Average surface atmospheric pressure is 1013MB. Decreasing pressure along the vertical axis represents increasing height above the earth's surface.
Temperature and Dewpoint (Moisture) Profiles
The dark red line represents the satellite derived temperature profile as a function of height (decreasing pressure).
The brighter red line represents the AVN forecast temperature profile as a function of height. In general, the GOES soundings tend to modify the dewpoint (moisture) profile more than the temperature profile.
The dark blue dashed line represents the satellite derived dewpoint profile as a function of height. The dewpoint is the temperature at which condensation would occur as the air is cooled. Warmer dewpoint temperatures correspond to moister atmospheric conditions, and cooler dewpoints to dryer atmospheric conditions.
The brighter blue dashed line is the AVN forecast dewpoint profile
The solid green line represents the temperature a parcel of low level air would have if it were lifted through the atmosphere. The temperature of this parcel drops dry adiabatically until it is saturated. Thereafter, as the parcel is lifted upward its temperature falls moist adiabatically
Gradient Winds
The black lines at the right edge of the chart represent the "gradient" winds, in knots. The wind direction is depicted by the angle of the line. A line pointing to the left indicates a wind from the west, a line pointing up a wind from the north, a line pointing to the right a wind from the east, and a line pointing down a wind from the south. These winds are calculated using horizontal fields of geopotential heights derived from GOES soundings. By measuring gradients in temperature and moisture at a particular pressure level, atmospheric wind estimates can be derived.
It should be noted that since these winds are computed from fields of GOES soundings, they may not always be available. In situations where extensive cloudiness surrounds the GOES sounding, there may not be sufficient data to derive a valid field. In these cases, the gradient wind information will not be displayed.
http://www.osdpd.noaa.gov/ml/air/soundings
The POES Temperature and Moisture Soundings Profiles are displayed in Skew-T Log-P diagram format. These diagrams include both the POES and the first guess (model data). Also included are several derived parameters to the right of each diagram. The POES thermal gradient winds (derived from the Soundings) are also displayed on the diagrams. The background image is generated from the AVHRR composite. Please select a region of interesting from the global map below.
POES SKEW–T
http://www.osdpd.noaa.gov/pskewt/USACON.html
GOES SKEW-T http://www.osdpd.noaa.gov/skewt/html/skewhome.html
ITSC-17 (1.27)
