2004-2010 NATIONAL ASSESSMENTS OF ELECTRONIC LABORATORY REPORTING IN HEALTH DEPARTMENTS SUMMARY
advertisement
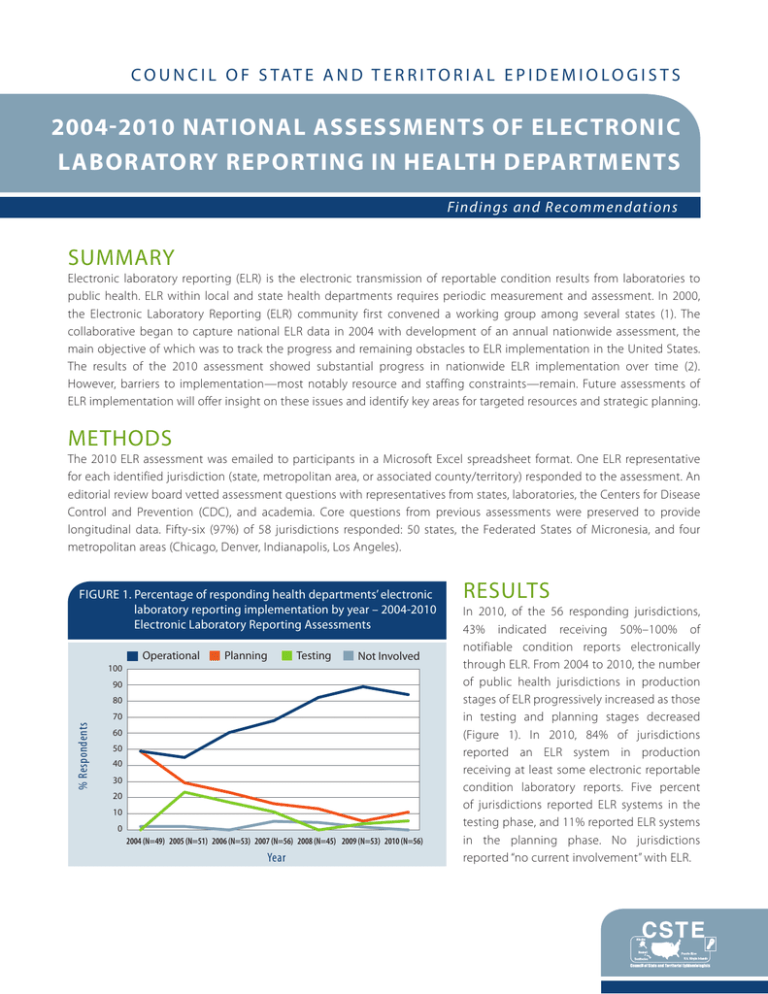
C O U N C I L O F S TAT E A N D T E R R I T O R I A L E P I D E M I O L O G I S T S 2004-2010 NATIONAL ASSESSMENTS OF ELECTRONIC LABORATORY REPORTING IN HEALTH DEPARTMENTS Findings and Recommendations SUMMARY Electronic laboratory reporting (ELR) is the electronic transmission of reportable condition results from laboratories to public health. ELR within local and state health departments requires periodic measurement and assessment. In 2000, the Electronic Laboratory Reporting (ELR) community first convened a working group among several states (1). The collaborative began to capture national ELR data in 2004 with development of an annual nationwide assessment, the main objective of which was to track the progress and remaining obstacles to ELR implementation in the United States. The results of the 2010 assessment showed substantial progress in nationwide ELR implementation over time (2). However, barriers to implementation—most notably resource and staffing constraints—remain. Future assessments of ELR implementation will offer insight on these issues and identify key areas for targeted resources and strategic planning. METHODS The 2010 ELR assessment was emailed to participants in a Microsoft Excel spreadsheet format. One ELR representative for each identified jurisdiction (state, metropolitan area, or associated county/territory) responded to the assessment. An editorial review board vetted assessment questions with representatives from states, laboratories, the Centers for Disease Control and Prevention (CDC), and academia. Core questions from previous assessments were preserved to provide longitudinal data. Fifty-six (97%) of 58 jurisdictions responded: 50 states, the Federated States of Micronesia, and four metropolitan areas (Chicago, Denver, Indianapolis, Los Angeles). FIGURE 1. P ercentage of responding health departments’ electronic laboratory reporting implementation by year – 2004-2010 Electronic Laboratory Reporting Assessments Operational Planning Testing Not Involved 100 90 80 % Respondents 70 60 50 40 30 20 10 0 2004 (N=49) 2005 (N=51) 2006 (N=53) 2007 (N=56) 2008 (N=45) 2009 (N=53) 2010 (N=56) Year RESULTS In 2010, of the 56 responding jurisdictions, 43% indicated receiving 50%–100% of notifiable condition reports electronically through ELR. From 2004 to 2010, the number of public health jurisdictions in production stages of ELR progressively increased as those in testing and planning stages decreased (Figure 1). In 2010, 84% of jurisdictions reported an ELR system in production receiving at least some electronic reportable condition laboratory reports. Five percent of jurisdictions reported ELR systems in the testing phase, and 11% reported ELR systems in the planning phase. No jurisdictions reported “no current involvement” with ELR. ELR SYSTEMS AND USES OF DATA The main purpose of ELR is to provide reportable condition data to end users, the most common of which were state program areas (91%), CDC or other federal agencies (79%), county/local health departments (74%), and centralized integrated data stores (74%). Other uses for ELR data included contributing to data analysis and visualization (87%), integrating ELR with NEDSS Base System (3) or similar system (72%), assisting in patient care (e.g., test ordering and result posting) (26%), offering health-care decision support (e.g., adjusting treatment on the basis of receipt of antimicrobial susceptibility data from ELR) (21%), detecting antimicrobial susceptibility patterns (21%), and contributing to syndromic surveillance (e.g., laboratory test order patterns) (15%). The development and implementation of ELR systems used in health departments varied by jurisdiction. Twentytwo percent of jurisdictions reported they had purchased their ELR system, 10% used a system built by in-house personnel, 50% used a hybrid system (both purchased and built), and 16% used a system built by contractors. Despite these differences, the interval from acquisition to full operation was similar regardless of system type. Twenty-four percent of in-house-developed systems/components were operational within 1 year, and 32% of jurisdictions that purchased systems/components were operational within 1 year. Jurisdictions reported receiving ELR data in Health Level Seven (HL7) (4) format (a health data standard format); the most common versions received in production were 2.3.1 (82%) and 2.3.z (44%) (Figure 2). Sixteen percent of jurisdictions reported having received data in version 2.5.1, specified in the Stage 1 Meaningful Use Menu Set Objectives for Eligible Hospitals (5). FIGURE 2. P ercentage of jurisdictions by type of Health Level 7 (HL7) format accepted in production-level electronic laboratory reporting systems–2008-2010 Electronic Laboratory Reporting Assessments 2008 (N=45) 2009 (N=53) 2010 (N=56) 90 % of Jurisdictions 80 70 60 50 40 30 20 10 0 2.3.z 2.3.1 2.5.1 Acceptance of data through ELR systems from nontraditional ELR sources (e.g., veterinary laboratories, poison control centers, emergency departments) was not widespread. Only 22% of test or production sites processed data from emergency departments; 12%, from case management or electronic medical records systems; 10%, from Health Information Exchanges; 6%, from immunization registries; 4% from veterinary laboratories; and 4%, from poison control centers (Figure 3). HL7 Format BARRIERS All jurisdictions were asked to identify and rank the three most important barriers to full ELR implementation. In 2010, the highest priority barriers were lack of health department funding (21%), competing priorities of laboratories (20%), lack of health department staffing (16%), and the inability to offer incentives (14%). 2004–2010 National Assessments of Electronic Laboratory Reporting in Health Departments FIGURE 3. N ontraditional uses of electronic laboratory reporting data – 2008 -2010 Electronic Laboratory Reporting Assessments 2008 (N=45) 2009 (N=53) 2010 (N=56) % of Jurisdictions 25 20 15 10 5 0 Emergency Departments Case Management or Electronic Medical Records Systems Health Information Exhanges Immunization Registries Veterinary Laboratories Poison Control Centers RESOURCES Collective resources required to build and maintain functional ELR ranged from <$1 million to >$5 million. In 2009, 20% of jurisdictions reported investing >$5 million on ELR activities and, in 2010, 21%. The highest expenses were information technology staff (52% of jurisdictions) and software (23%). PERSONNEL AND TRAINING The number of full-time equivalent (FTE) personnel assigned to ELR activities in the health departments has varied over time. Twenty-three percent of jurisdictions in 2010 indicated zero ELR FTEs—a sharp decline from 38% in 2009 and 33% in 2008 (Figure 4). The 2010 ELR Assessment showed an increase in the percentage of jurisdictions reporting at least one FTE assigned to ELR (29%), an increase from the 2009 assessment (18%) and the same as the 2008 assessment (29%). Thirty-four percent of jurisdictions in 2010 reported two to three FTEs dedicated to ELR activities, and 15% have four or more ELR FTEs. FIGURE 4. N umber of electronic laboratory reporting assigned full time equivalents by responding jurisdictions – 2008-2010 Electronic Laboratory Reporting Assessments 2008 (N=45) 2009 (N=53) 2010 (N=56) 40 35 % of Jurisdictions 30 25 20 15 10 5 0 0 1 2 3 4 ≥5 No. FTEs assigned to ELR 2004–2010 National Assessments of Electronic Laboratory Reporting in Health Departments In 2010, the training needs identified for existing ELR staff included training in LOINC® or SNOMED coding (75%), HL7 messaging (71%), and public health informatics (46%). Similarly, respondents indicated the need for additional staff already trained in these areas. Forty-three percent of jurisdictions indicated messaging experts with skills, such as HL7, LOINC®, and SNOMED, as the additional staff most useful for ELR implementation and support. Additional staff, such as information technology personnel (27%), informaticists (20%), epidemiologists (5%), and medical technologists (2%), also were indicated as useful to ELR implementation in local and state health departments. CONCLUSION Despite the tremendous progress reflected by the results of the 2010 assessment, the need for better resources critically limits ELR implementation. Funding and staffing shortages negatively affect most jurisdictions’ ability to design, implement, and maintain ELR systems; recruit and support laboratories; and provide meaningful data to public health partners at local, state, and federal levels. Ongoing assessment, workforce training, strategic planning, and continued discussions at all levels of government in public health should continue to ensure nationwide implementation of ELR. REFERENCES 1.Coast2Coast Informatics. National ELR call minutes. Annual National Electronic Laboratory Reporting (ELR) survey data summary reports, 2004–2010. Available at www.coast2coastinformatics.com/ReferenceMaterial.html. Accessed February 16, 2012. 2.Magnuson JA. 2010 National Electronic Laboratory Reporting (ELR) Snapshot Survey: Summary of results. Available at http://coast2coastinformatics.com/2010NationalELRSurvey-Summary.pdf. Accessed July 15, 2011. 3.CDC. CDC’s NEDSS Base System. A disease surveillance partnership. Available at www.cdc.gov/partners/Archive/ NEDSS/index.html?s_cid=ncbddd_govd_036. Accessed July 15, 2011. 4.Health Level Seven International. Available at www.hl7.org. Accessed March 24, 2012. 5.Centers for Medicaid and Medicare Services. Eligible hospital and CAH meaningful use table of contents. Core and menu set objectives. Available at www.cms.gov/EHRIncentivePrograms/Downloads/Hosp_CAH_MU-TOC.pdf. Accessed February 16, 2012. 6.Logical Observation Identifiers Names and Codes (LOINC®). Available at http://loinc.org/. Accessed February 16, 2012. 7.International Health Terminology Standards Development Organisation. Systematized Nomenclature of MedicineClinical Terms (SNOMED CT). Available at www.ihtsdo.org/snomed-ct/. Accessed February 16, 2012. ACKNOWLEDGEMENTS The contributions of the state and local respondents and the ELR Editorial Review Board members from 2004–2010 are gratefully acknowledged. This publication was supported by the Epidemiology and Laboratory Capacity for Infectious Diseases Cooperative Agreement, U50-CI000486 and the Centers for Disease Control and Prevention Cooperative Agreement No. 5U38HM000414. Its contents are solely the responsibility of the authors and do not necessarily represent the official views of CDC. National Office | 2872 Woodcock Blvd | Suite 303 | Atlanta, Georgia 30341 | t 770.458.3811 | f 770.458.8516 | www.cste.org

