MASSACHUSETTS INSTITUTE OF TECHNOLOGY
2.71/2.710 Optics
HW6
Spring ’14
Posted April 7, 2014, Due April 16, 2014
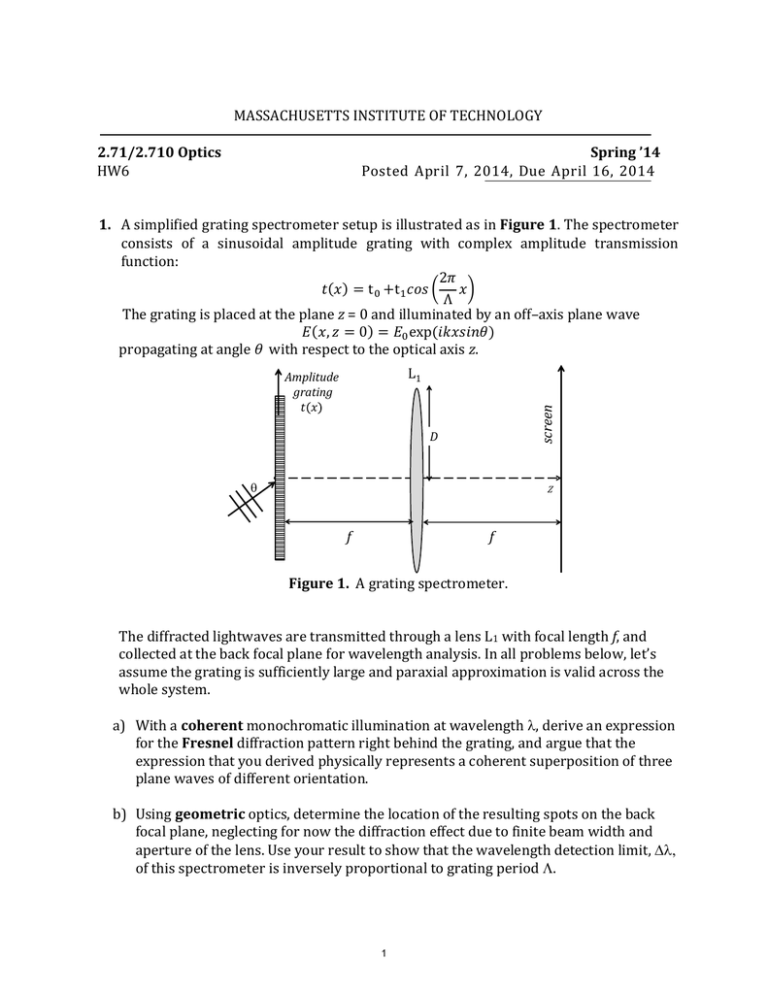
1. A simplified grating spectrometer setup is illustrated as in Figure 1. The spectrometer
consists of a sinusoidal amplitude grating with complex amplitude transmission
function:
2𝜋
𝑡(𝑥) = t 0 +t1 𝑐𝑜𝑠 ( 𝑥)
Λ
The grating is placed at the plane z = 0 and illuminated by an off–axis plane wave
𝐸(𝑥, 𝑧 = 0) = 𝐸0 exp(𝑖𝑘𝑥𝑠𝑖𝑛𝜃)
propagating at angle θ with respect to the optical axis z.
screen
L1
Amplitude
grating
𝑡 𝑥
D
q
Z
f
f
Figure 1. A grating spectrometer.
The diffracted lightwaves are transmitted through a lens L1 with focal length f, and
collected at the back focal plane for wavelength analysis. In all problems below, let’s
assume the grating is sufficiently large and paraxial approximation is valid across the
whole system.
a) With a coherent monochromatic illumination at wavelength , derive an expression
for the Fresnel diffraction pattern right behind the grating, and argue that the
expression that you derived physically represents a coherent superposition of three
plane waves of different orientation.
b) Using geometric optics, determine the location of the resulting spots on the back
focal plane, neglecting for now the diffraction effect due to finite beam width and
aperture of the lens. Use your result to show that the wavelength detection limit,
of this spectrometer is inversely proportional to grating period .
1
c) (2.710 only) Now taking into account of the diffraction effect due to finite beam
width W, estimate the resulting spot width of the diffracted order at the back focal
plane at monochromatic wavelength . Evaluate again the minimum spectral
resolution of the grating spectrometer.
2. (Goodman 5-9)Effect of defocusing: A unit-amplitude, normally incident
monochromatic plane wave illuminates an object of maximum linear dimension D,
situated immediately in front of a larger positive lens of focal length f , as shown
below. Due to a positioning error, the intensity distribution is measured across a plane
at a distance d − ∆ behind the lens. How small must ∆ be if the measured intensity
distribution is to accurately represent the Fraunhofer diffraction pattern of the object?
© McGraw-Hill. All rights reserved. This content is excluded from our Creative
Commons license. For more information, see http://ocw.mit.edu/fairuse.
Figure 2(Goodman 5.18). Schematic of a measurement of defocusing effect.
𝑥′
𝑥
f=2a
𝑥
f=a
Output Plane
3. As shown in Figure 3, the input images 𝑡1 (𝑥, 𝑦)and a phase mask 𝑡2 (𝑥′, 𝑦′) were placed
on the surface of the lens L1 and L2. The focal length of the lens L1 is f1 = 2a and that of
L2 is f2 = a. The spacings between L1 and L2 and the screen are all 2a.
a. Derive an expression for the light distribution on the screen.
b. (2.710 only) Can you suggest a possible application of such an arrangement?
𝑧
2
t2(x’, y’)
opaque
t1(x, y)
2a
2a
Figure 3. Optical information processing using 2 convex lenses
2
𝑥′
2
Output Plane
Input Plane
𝑥
Pupil plane
4. We are given a 4F imaging system consisting of two identical lenses L1, L2 with focal
length f =10cm. As an experiment, you attached a T shaped amplitude mask at the
pupil plane of the imaging system.
𝑧
opaque
f
f
f
f
X
3cm
1cm
Y
2cm
1cm
Figure 4. 4F imaging system with a T-shaped amplitude mask (dark area is completely
opaque, and white area is transparent) placed at pupil plane(X, Y).
a) A quasi–monochromatic, coherent point source at wavelength λ = 0.5µm, is placed
at the origin of the input plane (x = 0, y=0). calculate and sketch the Point Spread
Function of this lens system at output plane.
b) A coherent illumination field pattern at the input plane of the system is given by
𝐸0
2𝜋𝑥
2𝜋𝑥
2𝜋𝑥
𝐸(𝑥, 𝑦) = [3 + 𝑐𝑜𝑠 (
) + 𝑐𝑜𝑠 (
) + 𝑐𝑜𝑠 (
)]
2
4𝜇𝑚
2𝜇𝑚
𝜇𝑚
Calculate the output field and the contrast of the output intensity pattern for wavelength
=0.547 um(green) and 0.633 um (red).
3
5. We are given a 4F imaging system consisting of two identical lenses L1, L2 with
identical focal length f. A glass prism of refractive index n, base length w, and apex
angle α is placed at the pupil plane of the telescope. In all questions below, the
illumination is assumed to be monochromatic at wavelength λ.
Figure 4. Schematic of a 4F imaging system with a biprism placed at pupil plane(X”,Y”).
a) Consider first a point source placed at the origin x = 0 at the input (object) plane, and a
ray departing at angle q from the point source. What is the angle with respect to the
optical axis z that the same ray emerges from the prism?
b) Use the answer to the previous question to determine the 1D point–spread function (PSF)
of this system, neglecting for now any diffraction effects due to the finite base length w
of the prism.
c) Now modify the 1D PSF, taking into account the finite base length w of the prism. You
may assume that the prism acts like a thin transparency and α « 1 radian for this
calculation.
d) (2.710 only) Now consider the rotationally symmetric version of the prism, also known
as an “axicon.” What is the 2D PSF of the rotationally symmetric system?
4
MIT OpenCourseWare
http://ocw.mit.edu
2.71 / 2.710 Optics
Spring 2014
For information about citing these materials or our Terms of Use, visit: http://ocw.mit.edu/terms.


