Laboratory Evaluation of Two Optical Instruments for
advertisement

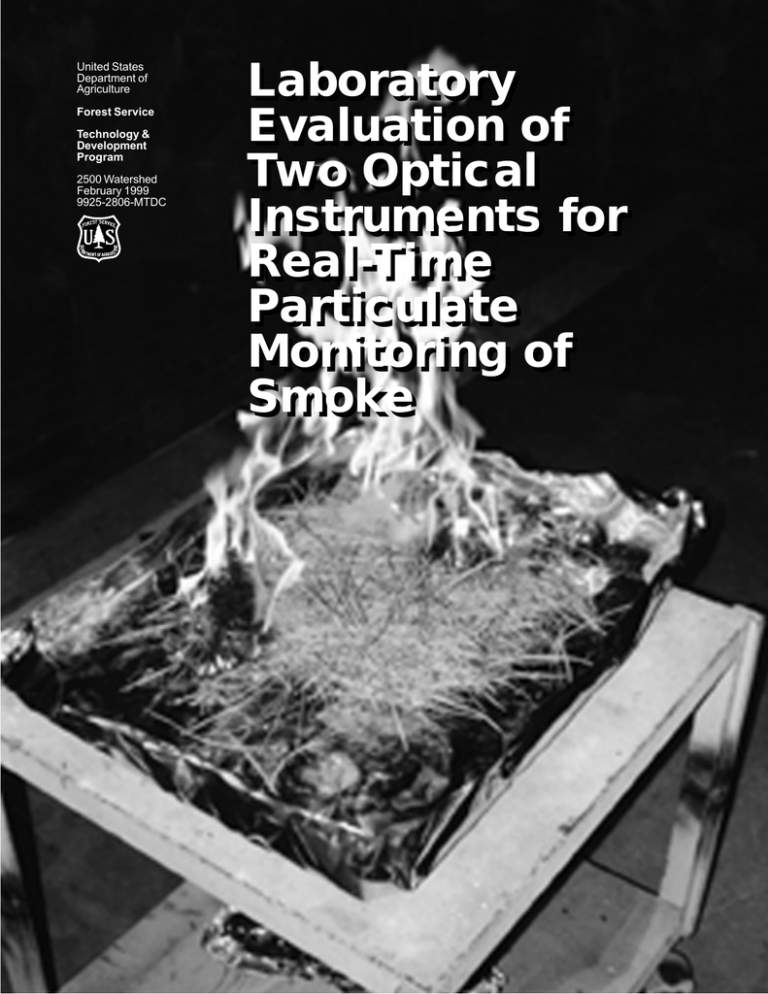
United States Department of Agriculture Forest Service Technology & Development Program 2500 Watershed February 1999 9925-2806-MTDC Laboratory Laboratory Evaluation of Two Two Optical Optical Instruments Instruments for for Real-Time Particulate Particulate Monitoring Monitoring of of Smoke Smoke 1 Laboratory Laboratory Evaluation Evaluation of of Two Two Optical Optical Instruments Instruments for for Real-Time Real-Time Particulate Particulate Monitoring Monitoring of of Smoke Smoke Andy Trent Project Leader Harold Thistle Program Leader Rich Fisher Air Resource Management, Washington Office The U.S. Department of Agriculture (USDA) prohibits discrimination in all its programs and activities on the basis of race, color, national origin, gender, religion, age, disability, political beliefs, sexual orientation, and marital or family status. (Not all prohibited bases apply to all programs.) Persons with disabilities who require alternative means for communication of program information (Braille, large print, audiotape, etc.) should contact USDA’s TARGET Center at 202-720-2600 (voice and TDD). To file a complaint of discrimination, write USDA, Director, Office of Civil Rights, Room 326-W, Whitten Building, 14th and Independence Avenue, SW, Washington, DC 20250-9410 or call (202) 720-5964 (voice or TDD). USDA is an equal opportunity provider and employer. Ronald Babbitt Electronics Engineer, Fire Sciences Laboratory Andria Holland-Sears Hydrologist, White River National Forest USDA Forest Service Technology and Development Program Missoula, Montana 8E82F54—Evaluate Two Nephelometers February 1999 2 Table of Contents Introduction _______________________________________________________ 1 Instruments _______________________________________________________ 2 Methods __________________________________________________________ 4 Results and Discussion ___________________________________________ 5 Conclusions _____________________________________________________ 10 Additional Tests __________________________________________________ 10 3ii Introduction A s land management agencies continue aggressive wildland burning programs, the effects of increased airborne particulate matter become of more concern to land managers. Real-time monitoring of airborne particulates is critical to the land manager’s ability to protect human health, public safety, and visibility. Land managers need reliable methods to measure particulate concentrations at the time of the fire to help make operational decisions. Gravimetric techniques require that filters collect the particulate matter. The filters are later weighed at special facilities routinely used in air quality applications. Instruments that infer particulate concentration by measuring optical properties of the atmosphere (light scattering, absorption, or extinction) are more practical and useful for near realtime measurement. In March and July of 1998, the Missoula Technology and Development Center (MTDC) and the Fire Sciences Laboratory (FSL) evaluated two real-time optical instruments that estimate particulate concentrations by comparing them with two gravimetric devices. The March laboratory tests were conducted to determine whether the optical and gravimetric instruments showed significant differences when measuring smoke particles produced from burning wood under controlled conditions in an indoor chamber. Analysis of the data from these tests showed considerable differences between the two measurement techniques. Further laboratory tests in July gathered data to develop a correction curve for the optical instruments and to determine if there were significant differ-ences in the optical properties of smoke based on the type of fuel generating it. All results and conclusions were based only on laboratory tests. Further testing of the instruments in a field environment will be conducted to validate the laboratory results. This evaluation was funded by the USDA Forest Service’s Watershed, Soil, and Air Program. 4 1 Instruments S everal Forest Service Regions have already purchased optical instruments to measure airborne particulate levels. Two types of these instruments are the MIE DataRAM portable real-time aerosol monitoring system and the Radiance Research M903 nephelometer. Both instruments measure the extinction coefficient of light due to light backscattering (Bscat). Aerosol levels are commonly reported in mass concentration, usually expressed in micrograms per cubic meter (ug/m3). The mass concentration is estimated from Bscat by applying a conversion factor. The DataRAM (Figure 1) is a compact, self-contained instrument that internally estimates mass concentration from the measured Bscat (particulate measurement ranges from 0.1 ug/m3 to 400,000 ug/m3). It continuously displays the current and time-weighted average mass concentration while logging up to 10,000 data points. Optionally, the DataRAM can be configured with either a PM-2.5 or PM-10 impactor head to prevent particles larger than 2.5 or 10 microns, respectively, from entering the Figure 1–The MIE DataRam. optical chamber. In these tests, the PM 2.5 impactor head was used. For custom calibrations, particulate can be collected on a filter located in the base of the instrument. An in-line heater may also be installed for monitoring in conditions of high humidity (typically above 70% relative humidity) or fog. The tubular heater is designed to raise the temperature of the sampled air stream to evaporate liquid water from airborne particles or to eliminate fog droplets. measurement range from approximately 1 to 1000 ug/m3 when converted from Bscat. The instrument has an internal data logger that will store scattering coefficient averages and the operating parameters that are used to estimate the Bscat. The stored data can be retrieved using a personal computer through an RS232 port. Different averaging times and log intervals may be set. The instrument can store approximately 2 weeks of 5-minute averages. The M903 Radiance Research portable nephelometer (Figure 2) is a lightweight, low-power instrument designed for portable operation as well as general environmental monitoring. It measures and displays Bscat, not mass concentration like the DataRam. Mass concentrations must be calculated by hand from the Bscat readings. The instrument has a particulate We investigated a third instrument, the DustLite, manufactured by Rupprecht and Patachnick. The DustLite estimates mass concentration much like the MIE DataRAM, but the purchase price is a Figure 2–The Radiance Research nephelometer. 5 2 fraction of the DataRAM’s price. However, after an initial evaluation, we concluded that this instrument would not be satisfactory for Forest Service field use. Gravimetric filter samples of 2.5 um and smaller were collected concurrently with the optical instruments to determine actual particulate levels. For the March tests, two different instruments were used to gather the gravimetric samples. One was an Environmental Protection Agency (EPA) Reference Method PM 2.5 sampler manufactured by Rupprecht & Patachnick Co., Inc. (R&P). IML Air Science in Sheridan, WY, weighed the 47-mm diameter Teflon filters used by this instrument. The second instrument was a PM 2.5 sampler developed by the Fire Sciences Laboratory (FSL) for conducting airborne smoke studies. This instrument’s 37-mm diameter filters were weighed in a special environmentally controlled facility at the Fire Sciences Laboratory. Concentrations of particulate in micrograms per cubic meter were calculated from flow and gravimetric data. For the July series of tests, only the RMFSL filter system was available. 6 3 Methods T he laboratory study was conducted in the Fire Sciences Laboratory’s large (131,000-ft3) combustion chamber. All instruments were calibrated and operated on a smoke-sampling platform 55 feet above the chamber floor (Figure 3). The experiments were performed at ambient conditions inside the closed chamber (70 to 90° F and 30 to 50% relative humidity). Small beds of flaming and smoldering ponderosa pine needles on the chamber floor (Figure 4) generated smoke for the majority of tests. Smoke for the remainder of the tests was generated by burning a small amount of duff. The instruments were close to one another so they would be sampling approximately the same air. Fans helped mix the smoke in the chamber. A total of 66 tests were completed in March and July. The duration varied for each test. The higher concentration tests were shorter to prevent the gravimetric filters from becoming clogged. The lower concentration tests were longer to allow enough particulate to accumulate on the filters for accurate measurements. The average duration of the tests was about 1 hour. Figure 4 52% 3 1/2 x 5 3/8 6 3/4 x 8 1/2 Print to Outside Edge of Borders DO NOT Print Borders Figure 4–An example of the firebeds of pine needles used to produce smoke in the laboratory burn chamber. Figure 3 47% 4 11/16 x 3 1/8 10 x 6 3/4 Print to Outside Edge of Borders DO NOT Print Borders Figure 3–Instrument layout on the smoke platform in the burn chamber. 7 4 Results and Discussion T he estimated mass concentration of the DataRAM and the converted Bscat mass concentrations from the Radiance Research nephelometers give similar estimates of real-time particulate concentrations. Figure 5 shows the particulate concentration estimates of two DataRAMs and three Radiance Research nephelometers during Test No. 7 in March 1998. For this test, the temperature was 68° F and the relative humidity was 25%. The average value for each instrument was within +/6% of the mean value for all instruments. The particulate concentrations measured by the optical instruments were significantly higher than those measured by the gravimetric instruments for all concentration ranges and all instruments. Figures 6, 7, and 8 show the respective nephelometer concentrations plotted against the gravimetric concentrations. Concentration estimates for the optical instruments were made using conversion factors supplied by the manufacturer. Based on the best-fit lines, the Region 2 DataRAM, MTDC DataRAM, and the Radiance Research nephelometer showed PM 2.5 concentrations 2.1, 1.9, and 1.9 times higher, respectively, than those measured by gravimetric devices. The readings were nearly linear with a correlation coefficient (R2) of 0.97 and higher. Test results were compared when different materials (pine needles and duff) were burned. There was no significant difference in the instrument readings between the tests. Figure 9 shows the MTDC DataRam mass concentration readings for both pine needle and duff smoke plotted against the gravimetric concentrations. Particulate Monitor Test - All Instruments Test No. 7 700.00 Radiance (Fire Lab) 600.00 Radiance (MTDC #1) Instrument Concentration ( u g/m3) Radiance (MTDC #2) Region 5 DataRAM 500.00 Region 2 DataRAM 400.00 300.00 200.00 100.00 14:36:30 14:35:00 14:33:30 14:32:00 14:30:30 14:29:00 14:27:30 14:26:00 14:24:30 14:23:00 14:21:30 14:20:00 14:18:30 14:17:00 14:15:30 14:14:00 14:12:30 14:11:00 14:09:30 14:08:00 14:06:30 14:05:00 14:03:30 14:02:00 14:00:30 13:59:00 13:57:30 13:56:00 13:54:30 13:53:00 13:51:30 13:50:00 13:48:30 0.00 Time Figure 5–Estimated mass concentration readings of DataRAMs and converted mass concentration readings from the Radiance Research Nephelometer for Test No. 7 in March 1998. 8 5 Best Fit Line for Region 2 DataRAM All Data - March & July 98 1200 R2 DataRAM Concentration (u g/m3) 1000 y = 2.1605x 2 R = 0.9722 Region 2 DataRAM Linear (Region 2 DataRAM) 800 600 400 200 0 0 200 400 600 800 1000 1200 3 Filter Concentration (u g/m ) Figure 6–Best-fit line for Region 2’s DataRam based on the instrument’s estimated mass concentrations and results from the gravimetric sampler. 9 6 Best Fit Line for MTDC DataRAM All Data - July 98 900 800 MTDC DataRAM Concentration (u g/m3) y = 1.9342x 2 R = 0.9784 700 600 MTDC DataRAM Linear (MTDC DataRAM) 500 400 300 200 100 0 0 100 200 300 400 500 600 700 800 900 3 Filter Concentration (u g/m ) Figure 7–Best-fit line for MTDC’s DataRam based on the instrument’s estimated mass concentrations and results from the gravimetric sampler. 10 7 Best Fit Line for MTDC Radiance Research Nephelometer All Data - March & July 98 1000 Radiance Research Concentration (u g/m3) 900 y = 1.9014x 2 R = 0.9715 800 700 Radiance Research Linear (Radiance Research) 600 500 400 300 200 100 0 0 100 200 300 400 500 600 700 800 900 1000 3 Filter Concentration (u g/m ) Figure 8–Best-fit line for the Radiance Research nephelometer based on the instrument’s converted mass concentrations and results from the gravimetric sampler. 11 8 Comparison of DataRam Readings for Smoke Generated from Pine Needles and Duff 1000 900 Instrument Concentration (u g/m3) 800 700 600 MTDC DataRam (Pine Needles) 500 MTDC DataRam (Duff) 400 300 200 100 0 0 100 200 300 400 500 600 700 800 900 1000 3 Gravimetric Concentration (u g/m ) Figure 9–Comparison of the DataRam’s estimated mass concentration readings for smoke generated from pine needles and duff compared to results from the gravimetric sampler. 12 9 Conclusions T he MIE DataRAM and Radiance Research nephelometer both overestimated mass concentration of biomass smoke. Caution is advised when using optical instruments to determine mass concentrations of airborne smoke particulate. More accurate estimates of particulate concentration of biomass smoke can be achieved with the instruments tested if a correction factor of 0.53 (1/1.9) is applied to the optical reading (DataRAM concentration * 0.53). Since the correction factor is linear, the DataRAM can be programmed by the user to automatically output the corrected value. For the Radiance Research instrument, multiply the Bscat conversion factor suggested by the vendor by 0.53 when converting from Bscat to mass concentration. The effects of other common atmospheric scattering aerosols, such as sulfates, nitrates, and soil material were not evaluated. Our suggested correction factor may not be appropriate when the ambient aerosol budget is dominated by these nonbiomass aerosols or even when it includes some sizeable fraction of them. For this laboratory study, burning different biomass materials did not significantly affect the concentration estimates. Additional Tests W hen the ambient relative humidity is higher than 70%, optical instruments will have even greater bias estimating particulate mass concentrations than during dry atmospheric conditions. A high priority should be given to further investigating nephelometer operation in smoky, highhumidity environments. From this work, appropriate correction curves and/or more effective dryers may be developed. A series of field tests should be conducted using optical instruments and gravimetric instruments. Setting up the instruments adjacent to a relatively large prescribed burn would provide a realistic comparison. Further tests should be conducted with different fuel types (such as green branches and needles, or deciduous trees) and with different pollutant types (particularly sulfates, nitrates, and soil material) to further identify instrument characteristics. 13 10 About the Authors Ronald Babbitt has bachelor’s degrees in forestry and electrical engineering. He joined the Forest Service in 1975 and has worked in areas of forest utilization, forest engineering, and fire research. He now works with the Fire Chemistry Research Project at the Fire Sciences Laboratory in Missoula, MT. Rich Fisher has bachelor’s degrees in life science (U.S. Air Force Academy) and in meteorology (North Carolina State University). He has master’s degrees in earth science (Colorado State University) and in international and strategic studies (Naval War College). He is a certified consulting meteorologist and is Reserve Assistant to the Director of Weather for the U.S. Air Force in the Pentagon. Harold Thistle received a Ph.D. in plant science specializing in forest meteorology from the University of Connecticut in 1988. He is certified by the American Meteorological Society as a Certified Consulting Meteorologist (CCM), and worked as a consultant in private industry before joining MTDC in 1992. He served as the Center’s Program Leader for Forest Health Protection until 1998, developing modeling techniques that accurately describe transport of pesticides in the atmospheric surface layer and evaluating meteorological instrument systems for environmental monitoring. He now works with the Forest Health Technology Enterprise Team in Morgantown, WV. Andy Trent is a Project Engineer at MTDC. He received his bachelor’s degree in mechanical engineering from Montana State University in 1989. He came to MTDC in 1996 and works on projects for the Nursery and Reforestation, Forest Health Protection, and Watershed, Soil, and Air Programs. Andria Holland-Sears received her bachelor’s degree in watershed science from Utah State University in 1981. Before moving to Colorado in 1994, she worked extensively as an Air Resource Specialist for the Forest Service in the Pacific Southwest Region (5) out of Lake Tahoe. Now she works as a hydrologist on the White River National Forest. She also provides technical support related to smoke management and air quality to the Forest Service Regional Office in Denver. Additional single copies of this document may be ordered from: USDA Forest Service Missoula Technology and Development Center 5785 Hwy 10 W Missoula, MT 59808 Phone: (406) 329-3900 Fax: (406) 329-3719 E-mail: wo_mtdc_pubs@fs.fed.us For further technical information, please contact Harold Thistle or Andy Trent at the address above. Harold Thistle Phone: (304) 285-1574 E-mail: hthistle@fs.fed.us Andy Trent Phone: (406) 329-3912 Fax: (406) 329-3719 E-mail: atrent@fs.fed.us i


