Kent State University FlashFacts - Fall 2014 Student Enrollments
advertisement

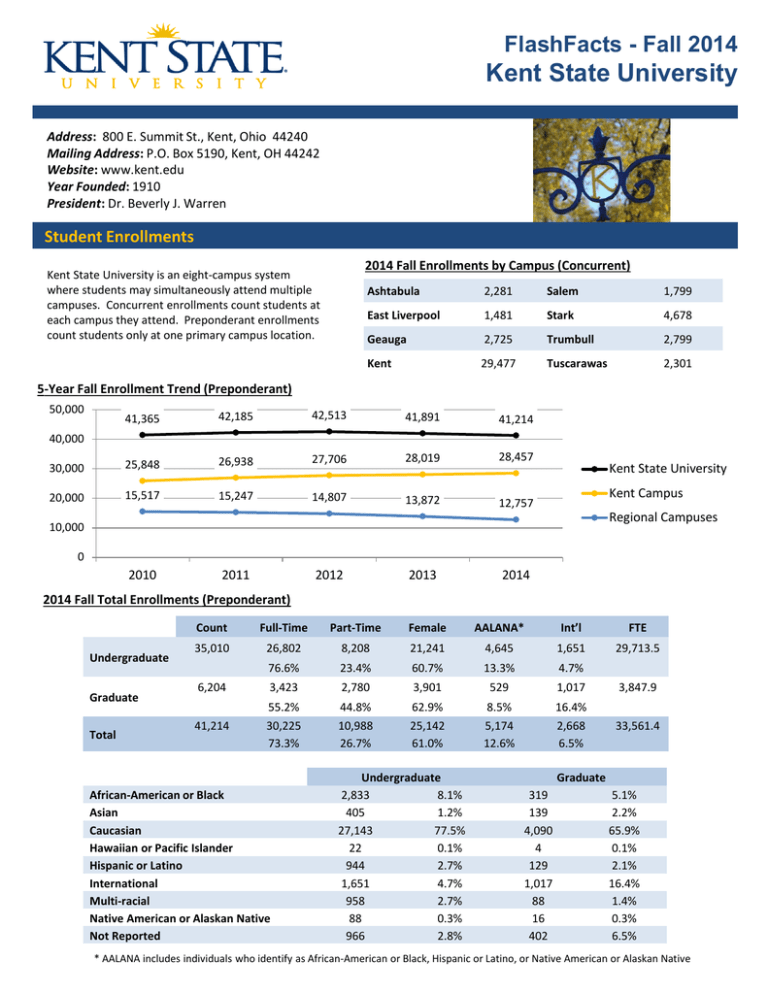
FlashFacts - Fall 2014 Kent State University Address: 800 E. Summit St., Kent, Ohio 44240 Mailing Address: P.O. Box 5190, Kent, OH 44242 Website: www.kent.edu Year Founded: 1910 President: Dr. Beverly J. Warren Student Enrollments 2014 Fall Enrollments by Campus (Concurrent) Kent State University is an eight-campus system where students may simultaneously attend multiple campuses. Concurrent enrollments count students at each campus they attend. Preponderant enrollments count students only at one primary campus location. Ashtabula 2,281 Salem 1,799 East Liverpool 1,481 Stark 4,678 Geauga 2,725 Trumbull 2,799 Kent 29,477 Tuscarawas 2,301 5-Year Fall Enrollment Trend (Preponderant) 50,000 41,365 42,185 42,513 41,891 41,214 30,000 25,848 26,938 27,706 28,019 28,457 20,000 15,517 15,247 14,807 13,872 12,757 40,000 Kent State University Kent Campus Regional Campuses 10,000 0 2010 2011 2012 2013 2014 2014 Fall Total Enrollments (Preponderant) Undergraduate Graduate Total Count Full-Time Part-Time Female 35,010 26,802 8,208 76.6% 23.4% 6,204 3,423 41,214 55.2% 30,225 73.3% African-American or Black Asian Caucasian Hawaiian or Pacific Islander Hispanic or Latino International Multi-racial Native American or Alaskan Native Not Reported AALANA* Int’l FTE 21,241 4,645 1,651 29,713.5 60.7% 13.3% 4.7% 2,780 3,901 529 1,017 3,847.9 44.8% 10,988 26.7% 62.9% 25,142 61.0% 8.5% 5,174 12.6% 16.4% 2,668 6.5% 33,561.4 Undergraduate 2,833 8.1% 405 1.2% 27,143 77.5% 22 0.1% 944 2.7% 1,651 4.7% 958 2.7% 88 0.3% 966 2.8% Graduate 319 139 4,090 4 129 1,017 88 16 402 5.1% 2.2% 65.9% 0.1% 2.1% 16.4% 1.4% 0.3% 6.5% * AALANA includes individuals who identify as African-American or Black, Hispanic or Latino, or Native American or Alaskan Native Student Enrollments and Success Degrees Issued AY 2013-2014 Kent Campus Success Measures Associate 1,261 Baccalaureate 4,776 Masters 1,555 Educational Specialist 28 Doctorate 145 Professional 114 Certificate 187 In-State Students (Total Enrollment) First Year Retention (2013 Cohort) 6-Year Graduation Rate (2008 Cohort) Based on fall cohort of first-time, full-time degree-seeking freshmen. Academic Offerings Undergraduate Graduate New Entrants, Fall 2014 New Freshmen 6,342 Undergraduate Transfers 2,214 New Graduate Students 1,909 Top Feeder High Schools Stow-Munroe Falls HS (Stow, OH) Nordonia HS (Macedonia, OH) Theodore Roosevelt HS (Kent, OH) GlenOak HS (Canton, OH) Hoover HS (North Canton, OH) Twinsburg HS (Twinsburg, OH) Jackson HS (Massillon, OH) Green HS (Green, OH) Lake HS (Uniontown, OH) Perry HS (Massillon, OH) New Phila. HS (New Phila., OH) Level Degrees Majors Associate 5 35 Baccalaureate 12 120 Master’s 22 115 Post-Master’s 1 6 Doctorate 4 49 Certificate 61 Student: Faculty Ratio (Kent Campus) = Top 10 Highest Enrollment Majors Undergraduate Graduate Nursing/Pre-Nursing Library Science Exploratory Nursing Psychology Podiatric Medicine Business Management Computer Science Criminology & Justice Studies Public Health Fashion Merchandising Journalism & Mass Communication Communication Studies Information Arch. & Knowledge Mgmt. Biological Sciences Music Education Accounting Digital Sciences Public Health Business Administration Lakeside HS (Ashtabula, OH) Research, Planning & Institutional Effectiveness • www.kent.edu/rpie • rpie@kent.edu • (330) 672-8222 Employee Headcounts As of November 1, 2014 Census Date. Counts are based on employee primary position. Classified Faculty Graduate Assistants Unclassified Total Count 1274 2623 1106 1819 6822 Full-Time 1092 85.7% 1341 51.1% 0 0% 1562 85.9% 3995 58.6% Part-Time 182 14.3% 1282 48.9% 1106 100% 257 14.1% 2827 41.4% Female 777 61.0% 1438 54.8% 618 55.9% 1049 57.7% 3882 56.9% AALANA* 166 13.0% 126 4.8% 76 6.9% 187 10.3% 555 8.1% Int’l 7 0.5% 197 7.5% 318 28.8% 74 4.1% 596 8.7% FTE 1179.7 Count Female AALANA* International FTE 1341 720 72 144 1342.0 53.7% 5.4% 10.7% 256 36 74 42.4% 6.0% 12.3% 106 12 44 51.2% 5.8% 21.3% 358 24 26 67.5% 4.5% 4.9% 718 54 53 56.0% 4.2% 4.1% 1438 126 197 54.8% 4.8% 7.5% Count Female AALANA* International FTE 183 50 10 29 183.0 27.3% 5.5% 15.8% 193 25 45 48.5% 6.3% 11.3% 119 13 44 51.7% 5.7% 19.1% 362 48 118 44.6% 5.9% 14.5% 1843.5 561.5 1685.1 5269.8 Faculty Detail Full-Time Faculty Tenured On Tenure Track Non Tenure Track Part Time Faculty Total 604 207 530 1282 2623 604.0 207.0 531.0 501.5 1843.5 Tenure Track Faculty Detail Professor Associate Professor Assistant Professor Total 398 230 811 398.0 230.0 811.0 * AALANA includes individuals who identify as African-American or Black, Hispanic or Latino, or Native American or Alaskan Native Research, Planning & Institutional Effectiveness • www.kent.edu/rpie • rpie@kent.edu • (330) 672-8222


