Any empirical paper should roughly follow the format outlined below. Introduction/Motivation
advertisement
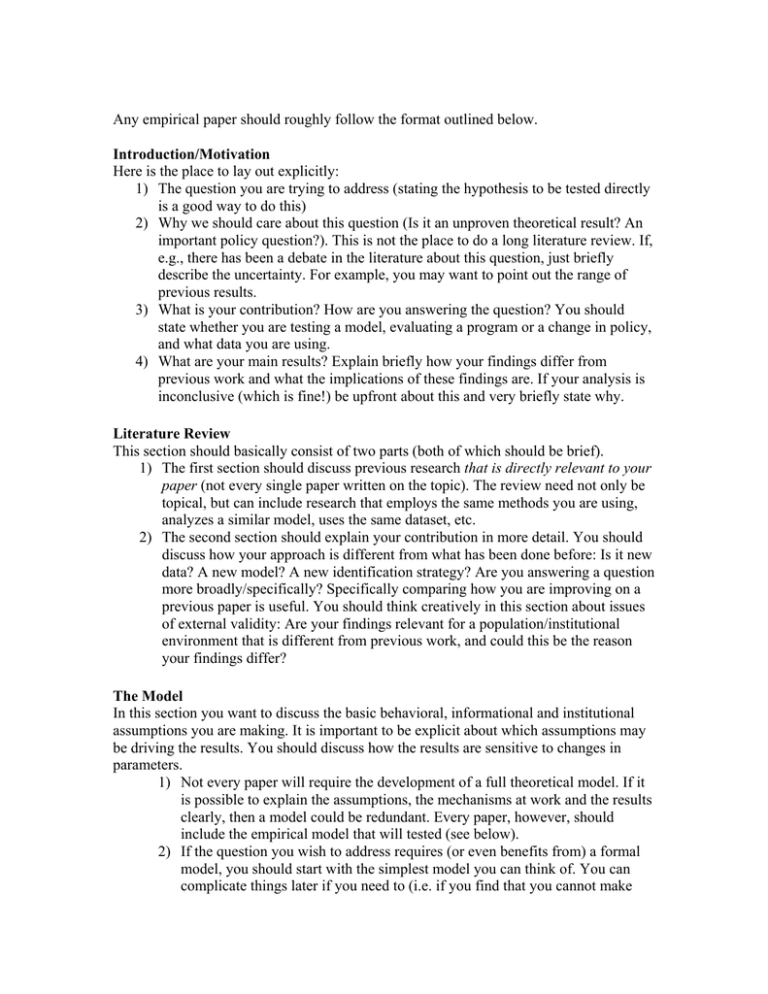
Any empirical paper should roughly follow the format outlined below. Introduction/Motivation Here is the place to lay out explicitly: 1) The question you are trying to address (stating the hypothesis to be tested directly is a good way to do this) 2) Why we should care about this question (Is it an unproven theoretical result? An important policy question?). This is not the place to do a long literature review. If, e.g., there has been a debate in the literature about this question, just briefly describe the uncertainty. For example, you may want to point out the range of previous results. 3) What is your contribution? How are you answering the question? You should state whether you are testing a model, evaluating a program or a change in policy, and what data you are using. 4) What are your main results? Explain briefly how your findings differ from previous work and what the implications of these findings are. If your analysis is inconclusive (which is fine!) be upfront about this and very briefly state why. Literature Review This section should basically consist of two parts (both of which should be brief). 1) The first section should discuss previous research that is directly relevant to your paper (not every single paper written on the topic). The review need not only be topical, but can include research that employs the same methods you are using, analyzes a similar model, uses the same dataset, etc. 2) The second section should explain your contribution in more detail. You should discuss how your approach is different from what has been done before: Is it new data? A new model? A new identification strategy? Are you answering a question more broadly/specifically? Specifically comparing how you are improving on a previous paper is useful. You should think creatively in this section about issues of external validity: Are your findings relevant for a population/institutional environment that is different from previous work, and could this be the reason your findings differ? The Model In this section you want to discuss the basic behavioral, informational and institutional assumptions you are making. It is important to be explicit about which assumptions may be driving the results. You should discuss how the results are sensitive to changes in parameters. 1) Not every paper will require the development of a full theoretical model. If it is possible to explain the assumptions, the mechanisms at work and the results clearly, then a model could be redundant. Every paper, however, should include the empirical model that will tested (see below). 2) If the question you wish to address requires (or even benefits from) a formal model, you should start with the simplest model you can think of. You can complicate things later if you need to (i.e. if you find that you cannot make any of the predictions you would like to test). Think carefully about functional form and continuous vs. discrete time (again, go for simplicity but be open about the assumptions and how they might drive the results). There are two important things to keep in mind here: a. The model should be simple and help illustrate the question you will be testing but should not be ad hoc. That is, don’t use a two period model because it is simple and gives you the result you want, if adding one more period to the model would negate these results. The form of the model should be appropriate to the problem. The easiest way to achieve this is to build on previous models that have been used to test this or related topics. b. In the end, you need an empirical model, so the theoretical model you develop must lead somehow to what you are testing. You will need to address how, say, the regression you are running is a linear form of an equation from your optimization problem. Be explicit about how the empirical model differs from the theoretical model, e.g. if you are unable to estimate certain parameters or if you need to assume a particular functional form. Data Description This section should be in two parts. 1) The first should simply describe the name and source of the data you are using and the period it covers. Describe whether you have a panel, cross section or time series, what the unit of observation is and how many observations you have. Discuss limitations of the data such as missing variables, missing observations, survey response, small number of observations, etc. You may want to highlight the important limitations (e.g. those that you might address in a falsification or robustness check later) in the body of the paper and put the rest in a footnote. It is useful to think about what the ideal dataset would be for the hypothesis you want to test and compare your data to it. 2) The second section should present (relevant) descriptive statistics of the data. You should have a couple of tables with means and standard deviations for the variables you will be using in the analysis (all of the outcomes, independent variables and controls). You may want to present these descriptive statistics for different subgroups (e.g. treatment vs. control; attriters vs. non-attriters; pre vs. post, etc.). The names of the variables should be clear to the reader. Econometric Model You should write out the basic econometric specification first and explain each of the variables and the parameters of interest. Why is this the correct specification for the question you wish to address? Was it derived from theory and has it been used in previous empirical work? Why are certain variables included and others not? Discuss whether you are using basic OLS, IV, etc. and why this is appropriate. You should be very clear about where identification is coming from and what assumptions you need to make in order to interpret the parameters as you wish to interpret them (e.g. discussing exclusion restrictions if you wish to interpret certain parameters as causal). After discussing the basic specification, write out any elaborations or additional tests you will perform and why. Results Here are some basic things to guide you in presenting your results: 1) You should present results in a way that develops your argument step-by-step. For example, you may want to present your main results first, then break those results down by subgroups and then perform robustness checks. 2) Any tables with parameter estimates should clearly state which dependent variable you are using, which control variables are included and which specification you are testing. Just discuss the most interesting and important estimates in your discussion of the table. Make sure you report standard errors with your estimates. Just look at some economics journals for a good table format. 3) Interpret the magnitude of your parameter estimates in an economically meaningful way. For example: “we find that b=0.003, so that increasing X by one unit increases y by 0.003. The implied elasticity is...”. This is particularly important if you are not estimating a simple OLS regression. And even with OLS it is useful, especially when the magnitudes of the variables are not immediately apparent, for example when x is in logs. 4) Make sure you give your parameters the smell test. Are they a reasonable sign and magnitude? 5) Graphs are worth a thousand words. Think about the most illustrative way of presenting the results in a graph…this is a very convincing way to show your reader that you have found something real. 6) Discuss whether the parameter estimates are statistically significant. If you don’t get significance, why? Do you have enough data? Is your test strong enough to detect effects below a certain magnitude (power tests are great for this sort of thing)? Are the results still suggestive even if they are not estimated precisely? 7) Compare your results to what others have found. You don’t need to worry if you don’t find anything significant as long as your methods are sound and you have interpreted the results well. Discuss why your results may differ from past research. Conclusion Summarize your findings and point out limitations of the results and possible extensions. This is a good place to speculate in a more casual manner about the implications of your results. In general, the conclusion should not contain any new results. Other General Comments o Substantiate general claims that are not proved in the paper either by providing relevant data or citing studies o Make an effort to write concisely and to the point (try to keep the text under 25 pages). Try to make the paper as short as possible and not to repeat arguments. Digressions and marginal comments belong in footnotes and not in the main text. o Long proofs, details on data collection and other secondary documents belong in the appendices of the paper. o It is not important whether or not you find “find results”. Rather, what is important is that you are as careful as possible in your methods so you can be confident about your conclusions. Problems you encounter should not be dismissed, hidden, etc. but rather you should try to address them. If you cannot address them than you should acknowledge the limitations of your approach, perhaps in the discussion section. o You should document what you do. In principle, another person should be able to read your paper and be able to reproduce your results. Some of these descriptions may belong in the appendix if they are very long. o Before you write, try to make an outline of the arguments and results that you want to present. o Remember that it is an economics thesis so it is important that you try to discuss your question and your results in that context.
