Document 13562477
advertisement

Prob. 3.3
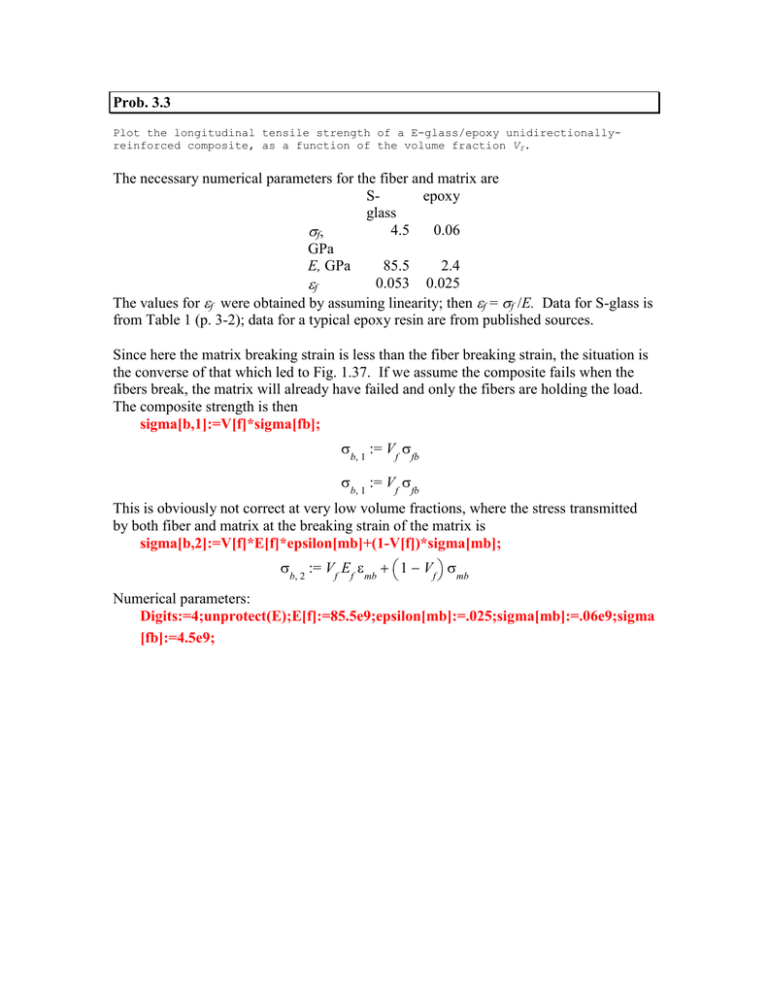
Plot the longitudinal tensile strength of a E-glass/epoxy unidirectionally­
reinforced composite, as a function of the volume fraction Vf.
The necessary numerical parameters for the fiber and matrix are
Sepoxy
glass
4.5
0.06
σf,
GPa
E, GPa
85.5
2.4
0.053 0.025
εf
The values for εf were obtained by assuming linearity; then εf = σf /E. Data for S-glass is
from Table 1 (p. 3-2); data for a typical epoxy resin are from published sources.
Since here the matrix breaking strain is less than the fiber breaking strain, the situation is
the converse of that which led to Fig. 1.37. If we assume the composite fails when the
fibers break, the matrix will already have failed and only the fibers are holding the load.
The composite strength is then
sigma[b,1]:=V[f]*sigma[fb];
σb, 1 := Vf σfb
σb, 1 := Vf σfb
This is obviously not correct at very low volume fractions, where the stress transmitted
by both fiber and matrix at the breaking strain of the matrix is
sigma[b,2]:=V[f]*E[f]*epsilon[mb]+(1-V[f])*sigma[mb];
σb, 2 := Vf Ef εmb + 1 − Vf σmb
Numerical parameters:
Digits:=4;unprotect(E);E[f]:=85.5e9;epsilon[mb]:=.025;sigma[mb]:=.06e9;sigma
[fb]:=4.5e9;
Plotting these two relations, over full and reduced scales of Vf: :
plot({sigma[b,1],sigma[b,2]},V[f]=0..1);
4e+009
3e+009
2e+009
1e+009
00
0.2
0.4
0.6
0.8
1
0.04
0.05
V[f]
plot({sigma[b,1],sigma[b,2]},V[f]=0..0.05);
2e+008
1.5e+008
1e+008
5e+007
00
0.01
0.02
0.03
V[f]
Whichever curve is greater for a given Vf should predict the composite strength.


