Document 13552248
advertisement
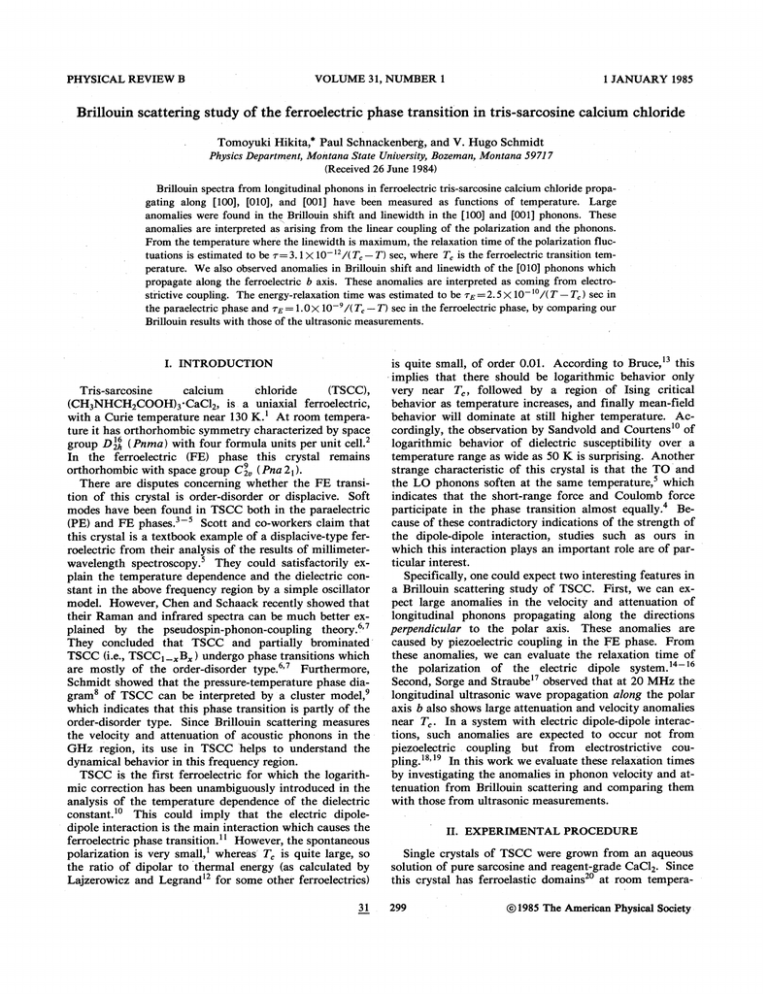
PHYSICAL REVIEW B VOLUME 31, NUMBER 1 1 JANUARY 1985 Brillouin scattering study of the ferroelectric phase transition in tris-sarcosine calcium chloride Tomoyuki Hikita, * Paul Schnackenberg, and V. Hugo Schmidt Montana State University, Bozeman, Montana 5971 7 (Received 26 June 1984) Physics Department, Brillouin spectra from longitudinal phonons in ferroelectric tris-sarcosine calcium chloride propaLarge gating along [100], [010], and [001] have been measured as functions of temperature. anomalies were found in the Brillouin shift and hnewidth in the [100] and [001] phonons. These anomalies are interpreted as arising from the linear coupling of the polarization and the phonons. From the temperature where the linewidth is maximum, the relaxation time of the polarization fluctuations is estimated to be ~=3. 1X10 ' /(T, —T) sec, where T, is the ferroelectric transition temperature. We also observed anomalies in Brillouin shift and linewidth of the [010] phonons which propagate along the ferroelectric b axis. These anomalies are interpreted as coming from electro2. 5&(10 ' /(T —T, ) sec in strictive coupling. The energy-relaxation time was estimated to be ~E — — — the paraelectric phase and ~E 1.0& 10 /(T, T) sec in the ferroelectric phase, by comparing our Brillouin results with those of the ultrasonic measurements. I. INTRODUCTION chloride Tris-sarcosine calcium (TSCC), (CH3NHCH2COOH)3. CaC12, is a uniaxial ferroelectric, with a Curie temperature near 130 K. ' At room temperature it has orthorhombic symmetry characterized by space group D2i, (Pnma) with four formula units per unit cell. En the ferroelectric (FE) phase this crystal remains orthorhombic with space group Cz„(Pna 2i). There are disputes concerning whether the FE transition of this crystal is order-disorder or displacive. Soft modes have been found in TSCC both in the paraelectric Scott and co-workers claim that (PE) and FE phases. this crystal is a textbook example of a displacive-type ferroelectric from their analysis of the results of millimeterThey could satisfactorily exwavelength spectroscopy. plain the temperature dependence and the dielectric constant in the above frequency region by a simple oscillator model. However, Chen and Schaack recently showed that their Raman and infrared spectra can be much better extheory. ' plained by the pseudospin-phonon-coupling They concluded that TSCC and partially brominated' TSCC (i.e., TSCCi undergo phase transitions which are mostly of the order-disorder type. ' Furthermore, Schmidt showed that the pressure-temperature phase diagram of TSCC can be interpreted by a cluster model, which indicates that this phase transition is partly of the order-disorder type. Since Brillouin scattering measures the velocity and attenuation of acoustic phonons in the the CzHz region, its use in TSCC helps to understand dynamical behavior in this frequency region. TSCC is the first ferroelectric for which the logarithmic correction has been unambiguously introduced in the analysis of the temperature dependence of the dielectric constant. ' This could imply that the electric dipoledipole interaction is the main interaction which causes the ferroelectric phase transition. However, the spontaneous polarization is very small, whereas' T, is quite large, so the ratio of dipolar to thermal energy (as calculated by Lajzerowicz and Legrand' for some other ferroelectrics) „B„) is quite small, of order 0.01. According to Bruce, ' this implies that there should be logarithmic behavior only followed by a region of Esing critical very near behavior as temperature increases, and finally mean-field Acbehavior will dominate at still higher temperature. cordingly, the observation by Sandvold and Courtens' of logarithmic behavior of dielectric susceptibility over a temperature range as wide as 50 K is surprising. Another strange characteristic of this crystal is that the TO and which the LO phonons soften at the same temperature, indicates that the short-range force and Coulomb force Beparticipate in the phase transition almost equally. cause of these contradictory indications of the strength of the dipole-dipole interaction, studies such as ours in which this interaction plays an important role are of particular interest. Specifically, one could expect two interesting features in a Brillouin scattering study of TSCC. First, we can expect large anomalies in the velocity and attenuation of longitudinal phonons propagating along the directions to the polar axis. These anomalies are perpendicular caused by piezoelectric coupling in the FE phase. From these anomalies, we can evaluate the relaxation time of of the electric dipole system. ' the polarization Second, Sorge and Straube' observed that at 20 MHz the longitudinal ultrasonic wave propagation along the polar axis b also shows large attenuation and velocity anomalies near T, . In a system with electric dipole-dipole interactions, such anomalies are expected to occur not from coupiezoelectric coupling but from electrostrictive In this work we evaluate these relaxation times pling. ' by investigating the anomalies in phonon velocity and attenuation from Brillouin scattering and comparing them with those from ultrasonic measurements. T„ ' " 31 II. EXPERIMENTAL PROCEDURE Single crystals of TSCC were grown from an aqueous solution of pure sarcosine and reagent-grade CaC12. Since at room temperathis crystal has ferroelastic domains 299 Q~1985 The American Physical Society HIKITA, SCHNACKENBERG, AND SCHMIDT 300 ture, single-domain portions were carefully examined with microscope. Exceptionally clear parts were chosen from these crystals and two samples which have the form of a rectangular parallelepiped 3X3X2 mm were prepared. One sample was cut so that the longitudinal phonons q [100] and q [010] could be measured by right-angle scattering and the other was cut so that longitudinal phonons q~~[001) and q~~[010] could be measured. The two samples were polished and then masked together by a blackened copper foil with pinholes for the incident and the scattered light beams. The masked sample pair was placed in a high-pressure optical cell described previously. ' The cell was filled with isopentane for index matching. The optical cell is surrounded by two radiation shields. The outer shield is directly connected to a liquid-nitrogen reservoir and the inner shield was temperature controlled at a temperature 6— 10 K lower than that of the optical cell. Thus, the optical cell temperature could be controlled within 3 mK during the measurement using a Lakeshore Cryotronics Model CSC-400 temperature controller. A Lexel Model 95-2 argon-ion laser operating in a single mode at a wavelength of 514.5 nm and a power level of 200 to 300 mW was used as the light source. The scattered light was collected in a cone of 1' and analyzed by a piezoelectrically scanned Burleigh Model 140 Fabry-Perot interferometer. Finesse optimization and drift control were achieved by a homemade control system using an AIM-65 microcomputer. The Fabry-Perot was scanned with a period of 10 sec and the signal was stored in a multichannel analyzer. The signal accumulation times was 10 to 20 min. Normally, the spacing of the etalon mirrors was adjusted to 40 to 50 mm. The finesse of the spectrometer was typically 42 to 46. Thus, the resolution of the spectrometer system was typically 77 MHz. The laser line broadening due to the jittering was claimed by the manufacturer to be about 10 MHz [full width at half maximum (FWHM)]. For deducing the natural-phonon linewidth, the natural-phonon spectrum and the instrumental function were assumed to be Lorentzian distributions, and the broadening due to collection optics was assumed to have a rectangular distribution. In. this case, the natural-phonon linewidth ( Wzh) is given by 8— ~ ( I I I I I I I f / I I I TSCC 6— 8RILLOUIN SHIFT ~A 21. ~ ~ ~ ~ O~ ~ ~ ~ ~ ~ 4— 21. qII IOOI] 2— 21. ~ ~ ~ =( W,b, —W, „s)' —W;„„, 8', and 8', „gdesignate the (1) Wph where strumental, I I I 21. a polarizing ~ I 31 b„8';„„, and collection optics linewidths, 0— 21. $~ ~o s~\ \ ~ ~ ~ ~~ ~ ~ ~ ft ~ C 208— Q qII 4z 206 — [010] ~ CD z 20.4— It+ ~ C3 LLI CL 16.2— ~t+o ~ ~~ ye ~~ ~ ~~ ~ ~ ~ ~ ~ ~ ~ ~ ~ ~ 4 ~ ~ ~ ~ 8— 15. q II [IOO] — 15.6, 0 ~ 4— 15. ~ ~ 15.2 I I I I I I I 200 150 I I 300 250 TEMPERATURE (K) FIG. 1. Temperature dependence of Brillouin shifts of longiphonons propagating along the a, b, and c axes in TSCC. Scattering are geometries x +y (zz}— x +y, x +y (zz)x — z, respectively. y, and y +z(xx)y — tudinal More detailed features near T, are shown in Figs. 2 — 4, where the temperature dependence of the Brillouin shift for the three phonon propagations is illustrated with an expanded temperature scale, together with the phonon decay rates. The temperature dependence of the Brillouin shift and the decay rate of the [100] phonons is quite similar to that of the [001] phonons though the anomalies are smaller for the latter case. In the above two cases, the I $1 I I I I I I I I I I t / I I I 'z~ l6.0— ~0 ~ ~ ~ ~ l I I I ( / ~ ~ ~ ~ ~ ~ ~ C9 I— —I5.8— LL (f) z' l5.6 —.. ~ 0~ Tscc C3 LLJ observed, inrespectively. ~0 ~ Lt l5.4— ~ ~ q ~y 1 I I) 00] —800 2— 15. III. RESULTS AND DISCUSSION —600 Figure 1 shows the temperature dependence of the Brilshift for longitudinal phonons propagating along [100], [010], and [001]. Each component shows an anomaly around T„with the [100] phonons showing the largest anomaly as well as the smallest Brillouin shift, and the [001] phonons showing the smallest anomaly. The shifts for the phonons with q~ ~[100] and [010] barely show temperature dependence in the PE phase well above but the shift for q~ ~[001] phonons shows appreciable temperature dependence in the high-temperature region. —400 louin T„ O —200 o 0 o o 0 I IO ~O l20 ~ 0 q& cP 0 0 IPf'e'a1 l30 9 l40 i i~ I i'i l50 i ~ 160 0 TEMPERATURE (K) FIG. 2. Temperature dependence of Brillouin shift ( ~ ) and linewidth (0 ) (F%'HM) of longitudinal phonons in TSCC propagating along the [100] direction. The scattering geometry is x +y (zz) x +y. — 31 BRILLOUIN SCATTERING STUDY OF THE FERROELECTRIC. I I I I LLI Tc ~~ lectric TSCC [010] qII . ~ ~o ~ ~ ~ ~ I I ~%p, 20.6— 20.4— 301 J U ~ I ~ ~ 20.8— ~ I I 2I.O— .. ~ oo ~ trictive 20.2— —200 r o o oa o oo I I I I l I I I l20 IO o oo o a I .—IOO 9Po a I 50 I I l I 40 I 0 I 50 Tm Tc ~ FIG. 5. 160 TEMPERATURE (K) FIG. 3. -Temperature dependence of Brillouin shift ( ~ ) and linewidth (o ) (FWHM) of longitudinal phonons in TSCC propagating along the [010] direction. The scattering geometry is x +y (zz)x —y. polarization and the strain couple bilinearly (LandauKhalatnikov type) in the FE phase. ' For these two phonon propagations, the velocity v and the attenuation a in ' the FE phase are given by' ' —[(v —utI)/(1+re =v u Anomalies in the velocity and the attenuation caused by piezoelectric coupling (I.andau-Khalatnikov type) and by electrostrictive coupling (fluctuations) for longitudinal phonons propagating perpendicular to the polarization axis. a=[(u„— uII)/2u )], rot (2) )], '/(1+ru rot ][co rI)t (3) T)/T„and q.o is ( T, — where t is the reduced temperature the individual-dipole relaxation time in the expression r=rct ' for the relaxation time r. The velocities u and limit velocities, utI designate the high- and low-frequency respectively. The Brillouin shift (hv) is given by bv=(vu/c)(n; +n, )'i (4) where v is the-incident light frequency, c is the speed of light in vacuum, and n; and n, denote refractive indices for the incident and the scattered light, respectively. The relaxation between the phonon decay rate I or the Brillouin linewidth (FWHM) I /n and the attenuation coeffinent u ~s given by From Eq. (2) we notice that the phase transition is marked by a quick drop in the velocity with decreasing However, experimentally the [100] and temperature. [001] phonon velocities do not exhibit such sharp drops at T„but rather show slow rounding. These anomalies are attributed to the quadratic coupling of the polarization and the strain or in other words, electrostrictive coupling' (fluctuation damping). Such contributions to the anomalies of the velocity and the attenuation are schematically illustrated in Fig. 5. As we see from Fig. 5, the temperature T at which the attenuation coefficient is maximum does not equal T„but occurs somewhat below T, . From Eqs. (2) and (3) we obtain the relation ' ( T, —T )/T, . =rodeo By this relation we can calculate the elementary relaxation time rc. Although the clear indication of T, is blurred by the additional small anomaly from the electrostrictive contribution, we can use the steepest dropping point of the velocity as T, . From the velocity and, attenuation for the above two cases, we obtain the following results: For the q l l [100] phonons, T, —T =0.3 K, I I I I wo I I I —2.4&10. '" sec I I I I I I I I I I I I I i I I l l 8— 4. I I I I I I I I ~ i I I r.gal 2I.6— ~~~ I l I I & l ~ ~ ~ I I ~ l I I I I ~ ~ ~ ~ LL & 21.4— TSCC I ~ q ~ ~ ~ ~ ~y TSCC q [0 0 I] ~ ~ ~o I I EOIO] C3 O bJ 2I.2 4J O —400 (3 4J ~ 4.7 IV U —200— o~ I IO I oP o& I I I I o Io I 20 I I O V) 0 o9 YooI i I I oI 50 I 00 I lo I o o I I I oI ol 0 I40 I I50 9 I Io 0 I60 I l10 TEMPERATURE (K) FIG. 4. Temperature dependence of Brillouin shift () and linewidth (0 ) (FWHM) of longitudinal phonons in TSCC propagating along the [001] direction. The scattering geometry is y ll E +z (xx)y —z. ]30 l40 I 150 I I l60 TEMPERATURE (K) FIG. 6. Temperature dependence of sound velocity in TSCC for Brillouin scattering (BS) at 16 GHz and for ultrasonic (US) measurements at 20 MHz. The velocity scale for the Brillouin scattering was adjusted to that of the ultrasonic measurements. HIKITA, SCHNACKENBERG, AND SCHMIDT 302 1.5 TSCC q 0— ll LOIOl 1. 0.5— The elementary relaxation times for this case are 2 orders of magnitude larger than those for the polarization relaxation. This is the reason why we cannot observe marked broadening in the Brillouin linewidth for the [010] phonons. Using the above ro values we estimate the Brillouin linewidth in attenuation units to be 280 cm ' at T —T, =0.9 K and 67 cm ' at T, —T=1.3 K. These values are too small when compared to the observed linewidths. For q [010] we find that the relaxation time is so long, cur&&l, that the relations (2) and (3) are no longer valid. 22 In this high-frequency regime we need a more developed mode-mode coupling theory to calculate the relaxation time. However, in this paper we shall only give a rough estimate of the relaxation time. In the case of q~ ~[010] propagation the coupling of the order parameter and the strain is quadratic, so the anomaly in the sound propagation is considered to arise from an oriIf we want to gin similar to that of the specific heat. study the relaxation time in more detail, we have to measure the attenuation and the velocity at various frequencies. This could be achieved by performing Brillouin (small-angle scattering). scattering at low frequencies Chen and Schaack ' obtained ro 2. 7)& 10 ' sec from their analysis of the pseudospin-phonon coupling of Raman and infrared spectra. This value is 1 order of magnitude larger than ours. Deguchi et al. showed that the relaxation time in TSCC is expressed by ~=3.8)&10 (e, e ) sec from their dielectric dispersion measurements. If we use the values C+=30 to 50 K for the Curie constant and the relation C+/C =2, we obtain the values ro 4. 4 to 8. 5— )&10 ' sec for the elementary relaxation time which is in relatively good agreement with our value. Though we can obtain an orderparameter relaxation time from the Brillouin scattering experiment, this does not necessarily mean that TSCC undergoes an order-disorder phase transition. It is also possible to adopt the interpretation that the soft-phoo, onmode frequency coo decreases and the damping constant y In such an extremely diverges as T, is approached. damped case, the system has the same correlation function as that of the relaxational mode where the effective relaxation time is given by y/coo. The most interesting feature of the Brillouin scattering in TSCC is the anomaly in the velocity and the decay rate of the [010] phonons. We estimated roughly the energy relaxation time in both the PE and FE phases. For convenience, we assumed that the critical index for rz is the. same as that of the polarization relaxation time. Generally, this is not true. It would be worthwhile to obtain the precise critical index for this relaxation time. For this Brillouin scattering is recompurpose, low-frequency mended also. This crystal is claimed to exhibit tricritical behavior at high hydrostatic pressure. Investigation of the change in the critical index of the relaxation time around such a multicritical point is very interesting and is now planned in our laboratory. ~ 0 120 l30 140 TEMPERATURE (K) 150 FIG. 7. Temperature dependence of attenuation in TSCC for Brillouin scattering (BS) at 16 GHz and for ultrasonic (US) measurements at 20 MHz. and for the q ~ ~ [001] phonons, T, —T =0.4 K, ~0 ——2. 3)&10 ' sec . The above two results agree well. We will use their aver2. 4&(10 ' sec, as the elementary relaxation time age, ~0 — of the polarization fluctuations in TSCC. The relaxation time of the polarization fluctuations obtained from the q~ ~[100] and q~ )[001] phonons is short compared to that of other order-disorder ferroelectrics. For instance, ro is 1.2X10 ' sec for potassium dihydro1.3&&10 ' sec for deuterated gen phosphate (KDP), KDP (DKDP), and 9.6X10 ' sec for triglycine sulfate (TGS).' Next we consider the temperature dependence of the Brillouin shift and the phonon decay rate for the longitudinal phonons parallel to the direction of the spontaneous polarization [010]. In this case, polarization fluctuations do not couple bilinearly to the strain, because of the appearance of the depolarization field in the longitudinal polarization wave. ' Therefore, the anomalies in the velocity and attenuation of these phonons should be explained by quadratic coupling of the polarization to the strain ' (electrostriction) in both PE and FE phases. We now compare the velocity and attenuation of the acoustic waves in the GHz and MHz regions. Ultrasonic have been pervelocity and attenuation measurements formed on this crystal by Sorge and Straube. ' Their results are reproduced in Figs. 6 and 7, together with our Brillouin results which are converted to velocity and attenuation scales. We use the velocities obtained by Brillouin scattering and ultrasonic measurements for v and vo, respectively. We assume the simplest form for the relaxation time to be ' where ro is the elementary relaxation time. ro t rE — ~, The E designates that these relaxation times are related to energy rather than polarization fluctuations. By putting into Eq. (3) the values of the attenuation coefficient of the T —T, at the temperatures ultrasonic measurements 9 and —1.3 K (2.7 and 11.1 dB/cm, respectively), we obtain the following values of the relaxation time: ~ =+0. 1.9&&10 ' sec for T&T, ro=7. 7&&10 ' sec for T&T, ~ — — ' — ACKNOWLEDGMENTS We thank Professor J. F. Scott for a helpful discussion. This work was supported in part by National Science Foundation Grant No. DMR-8205280. 31 BRILLOUIN SCATTERING STUDY OF THE FERROELECTRIC. 'On leave from Tohoku University, Sendai 980, Japan. 'Y. Makita, J. Phys. Soc. Jpn. 20, 2073 (1965). T. Ashida, S. Bando, and M. Kakudo, Acta Crystallogr. Sect. B 28, 1560 (1972). S. D. Prokhorova, G. A. Smolensky, I. G. Siny, E. G. Kuzminov, V. D. Mikvabia, and H. Amdt, Ferroelectrics 25, 629 (1980). 4G. E. Feldkamp, J. F. Scott, and W. Windsch, Ferroelectrics 39, 1163 (1981). ~G. V. Kozlov, A. A. Volkov, J. F. Scott, G. E. Feldkamp, and J. Petzelt, Phys. Rev. 8 28, 255 (1983). T. Chen and G. Schaack, J. Phys. C 17, 3801 (1984). 7T. Chen and G. Schaack, J. Phys. C 17, 3821 (1984). V. H. Schmidt, Solid State Commun. 35, 649 (1980). V. H. Schmidt, Ferroelectrics 39, 1151 (1981). ' E. Sandvold and E. Courtens, Phys. Rev. B 27, 5660 (1983). A. I. Larkin and D. E. Khmel'nitskii, Zh. Eksp. Teor. Fiz. 56, 2087 (1969) [Sov. Phys. JETP 29, 1123 (1969)]. J. Lajzerowicz and J. F. Legrand, Phys. Rev. B 17, 1438 (1978). A. D. Bruce, Adv. Phys. 29, 111 (1980) W. Rehwald, Adv. Phys. 22, 721 (1973). R. W. Gammon and H. Z. Cummins, Phys. Rev. Lett. 17, 193 (1966). T. Yagi, M. Tokunaga, and I. Tatsuzaki, J. Phys. Soc. Jpn. 40, 1659 (1976). — ~ .. 303 G. Sorge and U. Straube, Ferroelectrics 21, 533 (1978). I~M. A. Krivoglaz, Fiz. Tverd. Tela (Leningrad) 5, 3439 (1963) [Sov. Phys. Solid State 5, 2526 (1964)]. K. A. Minaeva, B. A. Strukov, and K. Varnstorff, Fiz. Tverd. Tela (Leningrad) 10, 2125 (1968) [Sov. Phys. Solid State 10, 1665 (1969)]. A. Sawada, Y. Makita, and Y. Takagi, J. Phys. Soc. Jpn. 42, — — 1918 (1977). M. Yamada and V. H. Schmidt, Rev. Sci. Instrum. 49, 1226 (1978). T. Hikita, J. Phys. Soc. Jpn. 53, 1513 (1984). K. F. Herzfeld and T. A. Litovitz, Absorption and Dispersion of Ultrasonic Waues (Academic, New York, 1959). ~4I. Tatsuzaki, M. Kasahara, M. Tokunaga, and H. Tanaka, Ferroelectrics 39, 1049 (1981). K. Kawasaki, in Phase Transitions and Critical Phenomena, edited by C. Domb and M. S. Green (Academic, New York, 1979), Vol. 5A, Chap. 4. A. Lopez-Echarri and M. J. Tella, J. Phys. D 14, 71 (1981). K. Deguchi, N. Aramaki, E. Nakamura, and K. Tanaka, J. Phys. Soc. Jpn. 52, 1897 (1983). U. Straube, G. Sorge, and N. R. Ivanov, Phys. Status Solidi A 73, 467 (1982). H. Reichelt, W. Windsch, and A. Sienkiewicz, Ferroelectrics 34, 195 (1981).
