3.032 Problem Set 6 Solutions
advertisement

3.032 Problem Set 6 Solutions
Fall 2007
Due: Start of Lecture, Wednesday 11.28.07
(NOTE THAT THIS DATE IS LATER THAN IN YOUR SYLLABUS.
PS7 WILL GO OUT ON 11.28 AND BE DUE ON 12.07.)
1. There is very little information available on wikipedia.org (http://en.wikipedia.org/wiki/)
about the strengthening mechanisms available to increase the yield strength of crystalline and
amorphous materials. Those wiki stubs that do exist are fragmented discussions of specific
materials, and there is very little discussion of the physical mechanisms that govern this
strengthening so that one could know how to choose a base material and/or alter the
microstructure of that material to achieve a target strength, or to know the fundamental limits of
the maximum attainable strength for a chosen mechanism.
Your task, individually and as a class, is to modify existing articles and create new articles,
graphics, examples, and links that describe the concepts covered in lecture (and beyond) as
clearly, accurately, and interestingly as possible. This is supposed to be interactive and the
article(s) will get better as everyone contributes, and should help you really understand and
integrate this material in prep for Quiz 3. The credit for this problem will be as follows:
Solution: See http://en.wikipedia.org/wiki/Strengthening_mechanisms_of_materials and links
associated with that page to review your collaborative work on this topic.
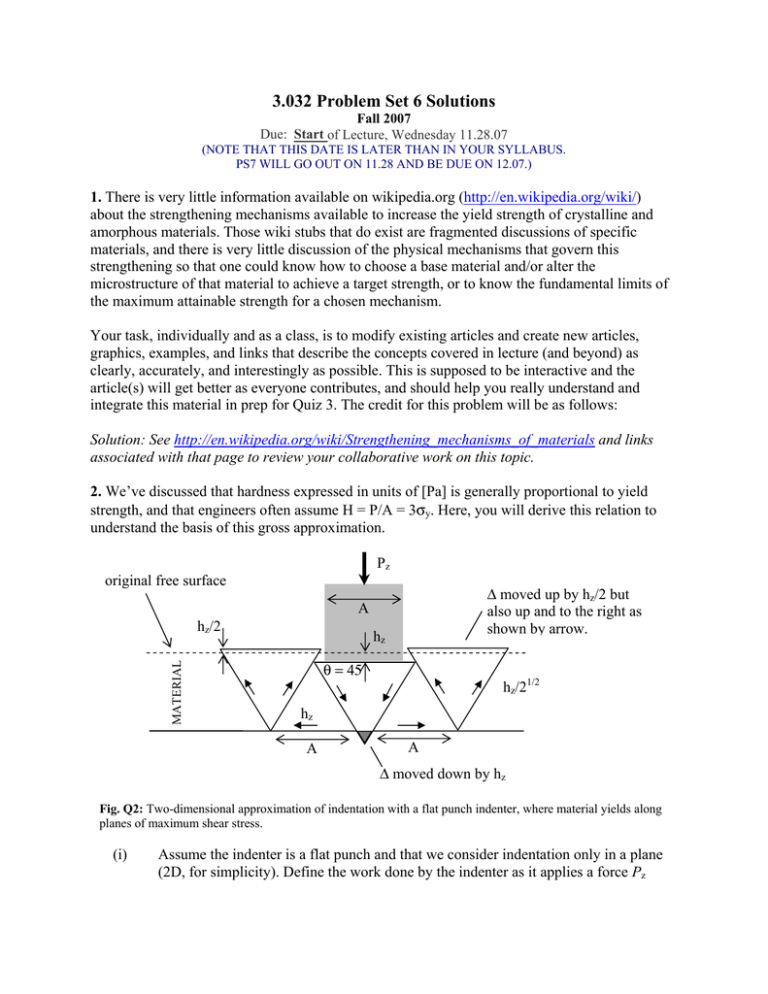
2. We’ve discussed that hardness expressed in units of [Pa] is generally proportional to yield
strength, and that engineers often assume H = P/A = 3σy. Here, you will derive this relation to
understand the basis of this gross approximation.
Pz
original free surface
Δ moved up by hz/2 but
also up and to the right as
shown by arrow.
A
MATERIAL
hz/2
hz
θ = 45
hz/21/2
hz
A
A
Δ moved down by hz
Fig. Q2: Two-dimensional approximation of indentation with a flat punch indenter, where material yields along
planes of maximum shear stress.
(i)
Assume the indenter is a flat punch and that we consider indentation only in a plane
(2D, for simplicity). Define the work done by the indenter as it applies a force Pz
acting over the punch width (or cross-sectional area in 3D) A to exert a vertical
displacement hz onto the material surface.
Solution: W = Pzhz
(ii)
Now assume the material beneath the indenter displaces only at locations of
maximum shear stress, as shown. Determine the relative displacement of the material
triangle edges (filled arrows) in terms of hz, and the “area” of those isosceles triangle
edges over which this displacement occurs.
Solution: As shown for θ = 45o,
Displacement u in shear diagonal direction = hz/21/2;
Displacement u in horizontal direction = hz
Area in shear diagonal direction = A/21/2
Area in horizontal direction = A (iii)
The triangles will only start to displace when the work done by the punch = work
required to attain shear stress in the material that is high enough to yield the material.
Equate the work in (i) to the sum of the work done on all of these internal triangle
edges (8 in total, shown in the Fig. Q2) that move under the shear stress τ. As the
displacement uz appears on both sides of this equality, you will obtain an equation of
the form P α Aτ.
Solution: Each work term is the product of force x distance, or shear stress*area x distance.
There are 2 arrows (and thus 2 work terms) associated with the triangle just beneath the
indenter, 2 horizontal arrows (and thus 2 work terms) associated with the two triangles next to
that middle one, and 4 arrows from the triangles to the extreme left and right. Summing these
work terms and equating with the input work from (i), we find:
Pzhz = (2 x Aτ/ ½ hz/2½) + (2 x Aτ x hz) + (4 x A/2½ x τ x hz/2½) Æ Pz = 6Aτ
(iv)
Since we have implicitly assumed the maximum shear stress or Tresca criterion in
this analysis, now express τ in terms of the yield strength according to this criterion,
and note that H is defined as P/A, to obtain an equation that relates H to σy.
Solution: H = Pz/A = 6τ = 6(σy/2) according to Tresca yield criterion = 3σy = H
Here, the key is to note that Tresca claims the critical shear stress required to plastically deform
a material to be equal to half the stress required to yield the material under uniaxial stress.
Mohr’s circle makes this easy to see.
(v)
Explain at least two cases where this approximation would be inaccurate, and whether
you think this proportionality factor would go up (so H is more than thrice the yield
strength) or down. To think about this, consider the simplifications that were made in
order to derive this relation. Note especially that hardness is a value you measure
2
after considerable yielding over a material volume has occurred, not just at the instant
that the yield stress is attained.
Solution: If the material is elastic-perfectly plastic (no strain hardening), then the stress
generated at any stress AFTER the yield stress is the same (equal to the yield stress), but this is
rarely observed in real materials.
Also, this model assumes the material undergoes yielding well predicted by the Tresca yield
criterion. Many materials do not deform under high pressure according to Tresca – they may fail
according to maximum normal stress or to von Mises yield criterion, or the materials may
fracture, phase transform, or dissipate energy in other ways including viscoelasticity.
3. Materials engineers have become increasingly interested in whether the yield strength of
crystalline materials changes as the physical size of the material decreases toward the nanoscale.
Until very recently, conducting uniaxial tension/compression tests on tiny material volumes <
100 microns in diameter was technically infeasible, but Uchic et al. have shown that they can
make and measure the compressive stress-strain response of single crystal Ni and other materials
for pillar diameters as small as 5 microns (see Fig. 2). The full paper is available on MIT Server, and
is a very cool read.
Images removed due to copyright restrictions. Please see
Fig. 1 in Uchic, Michael D., et al. "Sample Dimensions Influence
Strength and Crystal Plasticity." Science 305 (August 2004): 986-989.
Fig. Q3: (From Uchic et al., Science 305: 986, 2004). Mechanical behavior at room temperature for pure Ni
microsamples having a 134 orientation. (A) Stress-strain curves for microsamples ranging in size from 40 to 5
µm in diameter, as well as the stress-strain curve for a bulk single crystal having approximate dimensions 2.6 x
2.6 x 7.4 mm. (B) A scanning electron micrograph (SEM) image of a 20-µm-diameter microsample tested to
4% strain. The circle milled into the top surface of the microsample is a fiducial mark used during sample
machining. (C) A SEM image of 5-µm-diameter microsample after testing, where the sample achieved 19%
strain during a rapid burst of deformation that occurred in less than 0.2 s.
(a) The authors show an engineering stress vs. engineering strain response, but I don’t observe
the ultimate stress beyond yielding where the stress decreases before fracture. Why not?
3
Solution: No UTS in compression because compression generally does not create a localized
neck of deformation such that the cross-sectional area is changing in only one place prior to
fracture.
(b) For the Ni sample of 10 μm diameter and 2nd highest engineering fracture stress (~100 MPa),
replot these data as true stress vs. true strain (yes, you will need to pull some points off the
curve).
Solution: To convert:
σt = σe(1 + εe) = F/Ainstantaneous
εt = ln(1 + εe) – ln(L/Linitial) before necking, and = ln(A/Ainitial) both before and after necking.
You can graph this as negative stress and negative strain if you like, or graph the absolute value
so that stress-strain looks similar to tensile graph, but note that it is in compression. Let εe be a
negative number when converting to true strain, because physically, the length is decreasing
with respect to the initial length of the material sample.
(c) Determine the strain hardening coefficient of this sample from these data, and compare that
to literature values of n for Ni.
Solution: The simplest way to do this is to recognize that at stresses > yield stress, s = Kepn,
where ep is the plastic strain and is equal to etotal – eelastic. Then, we have
log σ = log K + n log(εp) such that n is the slope of this log σ vs. log εp graph.
s eng
(MPa)
s true (MPa)
e_total
(m/m)
e_plastic
80
80.4
0.005
0.0015
90
91.8
0.02
0.005
110
114.4
0.04
0.025
log(s true)
-2
log (e_p)
log(s)
1.905256
1.962843
2.058426
2.08
2.06
2.04
2.02
2
1.98
1.96
1.94
1.92
1.9
1.88
y = 0.126x + 2.258
R2 = 0.9965
-3
log(e_p)
2.82391
2.30103
1.60206
-1
0
4
This value of n = 0.13 is much lower than typical literature values for Ni (n ~ 0.2 to 0.3). This
may be because the capacity of a material with so much free surface to strain harden is reduced,
as dislocations easily create slip steps on the free surface rather than entangle inside the
material.
(d) The authors wanted to consider whether the yield strength as a function of pillar diameter
followed a Hall-Petch type relation. Why would they make this analogy between polycrystals
of decreasing size and single crystal pillars of decreasing size?
Solution: One pillar = one single crystal, so one pillar = one grain.
(e) Compute the average yield strength for each pillar diameter and graph σy as a function of d to
determine (i) whether Hall-Petch type strengthening is observed; (ii) What the “power” x of
such strengthening would be for a Hall-Petch type equation.
Solution: Hall-Petch says σy = σ o + kd -x, so Æ log σy = log σ o + log k – x log d
Pulling off the approximate yield strengths of the four different pillar diameters, we find the
slope (best fit least squares linear regression) of the log-log graph to be x = 0.62. Fairly decent
example of Hall-Petch expected value of x = -1/2.
s (MPa)
d (um)
120
90
50
35
5
10
20
40
log(s)
2.079181246
1.954242509
1.698970004
1.544068044
log(d)
0.69897
1
1.30103
1.60206
log(s)
2.079181
1.954243
1.69897
1.544068
2.5
log YS
2
1.5
y = -0.6181x + 2.5302
R2 = 0.9836
1
0.5
0
0
0.5
1
1.5
2
log d
4. Creep can occur via several different mechanisms in amorphous and crystalline materials,
each with their own activation energy Q. Typically, there is an Arrhenius behavior to this creep
response, with an exponential prefactor that is particular to the material considered and on the
operating mechanism.
5
(a) You are running two separate creep experiments on polycrystalline Ni, one at 527oC (=800
K) and the other at 532oC (=805 K). You observe that strain rate dε/dt increases by a factor of
1.5 for the sample tested at the higher temperature, as compared to the lower temperature.
Assuming there is a single dominant mechanism (and therefore a single activation energy Q) for
creep over this temperature range, determine Q.
Solution: Here, we consider a ratio of strain rates to solve for Q, because we assume that the
same mechanism and thus the same Q dominates over this small temperature range:
1
1.5
= Strain rate 1 α e-Q/RT1 Æ Q = ln(1/1.5) / (1RT2 – 1/RT1) = 434 kJ/mol
= Strain rate 2 α e-Q/RT2
(b) What do you think this deformation mechanism could be, and why? Note that the actual grain
size d and stress magnitude need not be stated to figure this out, but you can use deformation
mechanism maps (Fig. Q4) to narrow down your options, with key data for Ni indicated in figure
caption.
Solution: Must be a diffusive mechanism (not elasticity or plasticity or fracture) because the
above analysis indicates an Arrhenius relationship with a diffusion barrier Q.
At T/Tm = 0.36 (530/1455C), the deformation mechanism map indicates this could be
dislocation creep (QL) or Coble creep (Qgb) if the strain rate is 10-8/s (map on the left) or
dislocation creep (QL) if the grain size is 0.1 mm (map on the right). To check this, look up
energy barrier for self diffusion in Ni. If it’s on the order of 434 kJ/mol, reasonable to assume
dislocation creep is the dominant mechanism. If it’s smaller than that, you know that Qgb is less
than QL, and it’s reasonable to assume that Coble creep is the dominant mechanism and that the
grain size is NOT 0.1 mm.
(c) You are running these tests because you would like to develop a new polycrystalline Ni alloy
for Boeing aircraft engines. The Ni parts will be under a constant stress of about 1.3 GPa due to
centrifugal forces, and a temperature of about 1100oC. Which creep mechanism are you most
concerned about in this application, and how do you propose to modify the polycrystalline Ni
alloy to minimize creep rates for this application?
Solution: Now, T/Tm = 0.8 and s/G = 2 x 10⁻², so dislocation glide is the dominant mechanism
of deformation. This is NOT creep, so I’m not worried about designing a microstructure that is
particularly resistant to lattice or gb diffusion, and I’d want to include in my microstructure any
strengthening mechanisms that would increase the resistance to dislocation glide (e.g., solute
atoms, grain boundaries via grain size reduction, work hardening via prior plastic deformation
to increase dislocation density). However, since I know the next-fastest mechanism around this
temp/stress is dislocation creep, I would also design the microstructure to reduce lattice
diffusion (increase QL), potentially by adding solute atoms.
6
10+4
Fig. Q4. Deformation mechanism map for Ni of grain
size d = 32 um (left) and d = 100 um (bottom).
10-1
Ni shear modulus G = 76 GPa; tensile strength UTS =
320 MPa; melting temp T = 1455oC; fcc with atomic
radius r = 0.125 nm. R = 8.31 J/mol-K.
10+1
o
Temperature ( C)
0
200
Plasticity
Courtesy Elsevier, Inc.,
http://www.sciencedirect.com. Used with permission.
Normalised shear stress, σs/µ
10-3
600
800
1000 1200 1400
or
γ-
=
γ-
p
{
{
(L.T. Creep)
Power law
creep
10-3
{
σ
∆F
exp - kT (1 - ϕs )
∆Fk
σ 1/2 1/2
σs 2
( µ ) exp - kT (1 - ( ϕk ) )
p
γ- = γ- ο
10-2
10-8
400
Ideal shear strength
{
γ- =
103
{
A2 Deff µb
kT
σ
n
( µs )
σ 2 os Ds
Deff = Dv - 10 ( s ) (
)
µ
b2
10-4
(H.T. Creep)
10-5
10-6
Pure nickel
d = 0.1 mm
Diffusional
flow
(Boundary
diffusion)
0
0.2
0.4
0.6
{
γ=
42σs
2
kTd
Deff
Deff = Dv +
0.8
Homologous temperature, T/T
102
o
-200
10-1
10
1
σδDs
d
(Lattice
diffusion)
Shear stress at 27 C (MN/m2)
10-4
10-1
1.0
M
Figure by MIT OpenCourseWare.
7


