1 2 3
advertisement
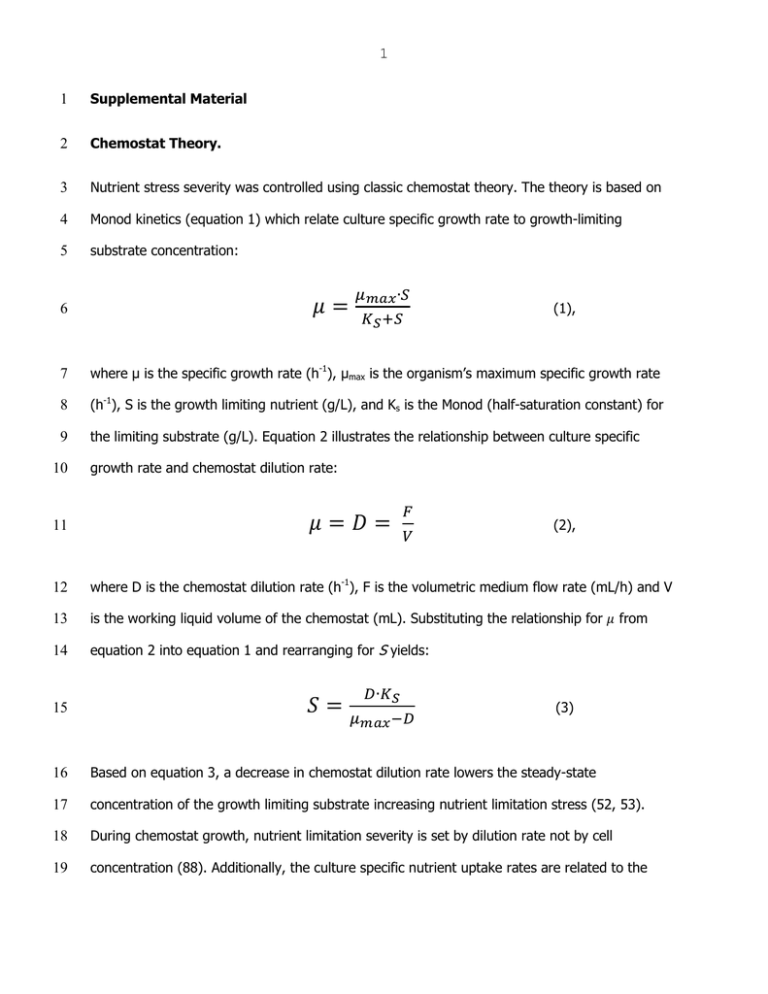
1 1 Supplemental Material 2 Chemostat Theory. 3 Nutrient stress severity was controlled using classic chemostat theory. The theory is based on 4 Monod kinetics (equation 1) which relate culture specific growth rate to growth-limiting 5 substrate concentration: (1), 6 7 where µ is the specific growth rate (h-1), µmax is the organism’s maximum specific growth rate 8 (h-1), S is the growth limiting nutrient (g/L), and Ks is the Monod (half-saturation constant) for 9 the limiting substrate (g/L). Equation 2 illustrates the relationship between culture specific 10 growth rate and chemostat dilution rate: (2), 11 12 where D is the chemostat dilution rate (h-1), F is the volumetric medium flow rate (mL/h) and V 13 is the working liquid volume of the chemostat (mL). Substituting the relationship for 14 equation 2 into equation 1 and rearranging for S yields: 15 from (3) 16 Based on equation 3, a decrease in chemostat dilution rate lowers the steady-state 17 concentration of the growth limiting substrate increasing nutrient limitation stress (52, 53). 18 During chemostat growth, nutrient limitation severity is set by dilution rate not by cell 19 concentration (88). Additionally, the culture specific nutrient uptake rates are related to the 2 20 specific growth rates and the respective biomass yields. For example, the specific glucose 21 uptake rate (qglc, g glucose/ g cdw / h) can be defined by: (4) 22 23 where Ybiom/glc is the biomass yield on glucose (g cdw / g glucose). 24 25 TABLE S1 Isoelectric focusing protocol 26 Step Type Voltage limit Time/Volt Hours 27 1 Step & Hold 500V 825 vh 28 2 Gradient 1000 V 8h 29 3 Gradient 3000 V 1h 30 4 Step & Hold 3000 V 31 5 Gradient 8000 V 32 6 Step & Hold 8000 V 33 7 Gradient 10000 V 1h 34 8 Step & Hold 10000 V 36000 35 9 Hold 500V ∞ 4500 vh 1h 12000 vh 36 37 TABLE S2 Found in Excel Workbook “Supplemental_Data.xlsx” contains yields, specific glucose 38 uptake rates and siderophore (competitive iron-binding capacity) by dilution rate and culturing 39 condition. 40 3 41 TABLE S3 Found in Excel Workbook “Supplemental_Data.xlsx” contains spot volumes exported 42 from progenesis for the membrane fraction, expression profile plots, statistics from progenesis, 43 brief description of protein, categorized isoform counts, and MASCOT information. Links to 44 MASCOT results (for as long they remain active). 45 46 TABLE S4 Found in Excel Workbook “Supplemental_Data.xlsx” contains spot volumes exported 47 from for the membrane fraction, expression profile plots, statistics from Progenesis, brief 48 description of protein, categorized isoform counts, and MASCOT information. Links to MASCOT 49 results (for as long they remain active). 50 51 TABLE S5 Proteins observed in the current study that have been associated with Fur or RyhB 52 regulation based on previous transcriptomics studies. Associated gene listed in parentheses 53 after protein name. Transcript data from 1) McHugh et al., 2003 J. Biol. Chem. 278(32) 29478- 54 29486 and 2) Masse et al., 2005 J. Bactriol. 187(20) 6962-6971. 55 56 Bfr (bfr), CirA (cirA), CspC (cspB, cspI), ElaB (elaC), FepA (fepE, fepC, fepG, fepD), FhuA 57 (fhuA), FimA (fimE), OmpX (ompX), OppA (oppA), PepB (pepB), PepD (pepB), PflB (pflA), PyrB 58 (pyrL), PyrI (pyrL), RplI (rplL), RplL (rplL), SodA (sodB), SodB (sodB), YbaY (ybaY). 59 60 61 62 FIG S2. Heatmap of all identified proteins with hierarchical clustering can be found in the Excel 63 Workbook “Supplemental_Data.xlsx”. 64 65 4 66 5 67 68 FIG S1. Representative 2-dimensional gels for the E. coli cytoplasm protein fraction (a) and 69 membrane protein fraction (b) as a function of iron- or glucose-limited growth. Several proteins 70 are labeled for orientation purposes. Magenta (Fe): iron-limited chemostat data. Cyan (C): 71 glucose-limited chemostat data. 72
