Photos from the IHOP Field Experiment May - June 2002
advertisement
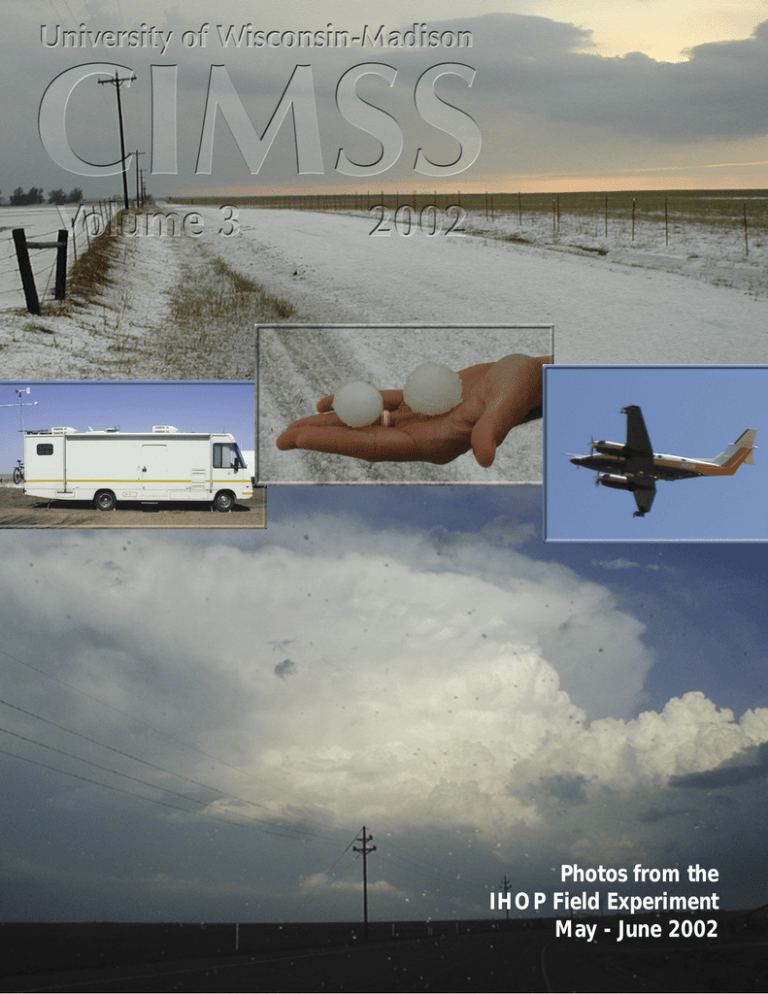
Photos from the IHOP Field Experiment May - June 2002 Table of Contents CIMSS Participates in International H2O Project ............................................................4 Suomi-Simpson Graduate Fellowship Winner Announced ..............................................6 Wildfire ABBA Goes Operational ....................................................................................7 Fire Detection with Scanning-HIS ..................................................................................8 Summary of the Sixth International Winds Workshop ..................................................10 Suomi Scholarship Award Winners Announced ............................................................10 Clear Sky Brightness Temperatures from the GOES-8 and -10 Imagers ........................11 If you would like to be added to our mailing list to receive the CIMSS newsletter, please contact Leanne Avila (email: leanne.avila@ssec.wisc.edu). If you would like to learn more about CIMSS, please visit our web site: http://cimss.ssec.wisc.edu/ CIMSS Board of Directors Martin Cadwallader, Steve Ackerman, Hank Revercomb, John Young, Gregory Withee, Marie Colton, Jeff Key, Ghassem Asrar, Leonard McMaster, Franco Einaudi CIMSS Scientific Advisory Council Steve Ackerman, Allen Huang, Chris Velden, Jon Martin, John Norman, Arnie Gruber, Fran Holt, Robert Ellingson, Graeme Stephens, Pat Minnis, Michael King Editor: Leanne Avila Original Design by Betsy True Revised by Leanne Avila CIMSS Cooperative Institute for Meteorological Satellite Studies University of Wisconsin-Madison 1225 W. Dayton St. Madison, WI 53706 608-263-7435 http://cimss.ssec.wisc.edu/ CIMSS • 2002 2 Note from the Director I n a Space Policy article in 1986, William Bishop reviewed the advances in remote sensing of the Earth from the previous 25 years.1 He noted "Remote sensing from space can only thrive as a series of partnerships." He used CIMSS as a positive working example of a government-academia partnership, noting "the Institute pioneered the computation of wind speeds at cloud heights by tracking cloud features from image to image. These are now a stable product provided from the satellites to the global models at the National Meteorological Center." CIMSS continues to be a leader in the measurement of winds from satellite observations and recently hosted an international winds workshop. A summary of that meeting is included in this issue. This issue gives an overview of two of the latest products to transition to NOAA: Biomass Burning and Clear-sky Brightness Temperature. Many research projects originating in CIMSS have become operational algorithms. The table below lists satellite products in NESDIS Operations developed at CIMSS. 1Bishop, William P, 1986 Partnerships in remote sensing: A theme with some examples. Space Policy, November, pp 322-341. The development of new analysis methods often stems from field programs. Data analysis from two field programs, IHOP and SAFARI, is presented in accompanying articles. As it was 16 years ago, so it is today; CIMSS is a positive example of the merits and benefits that stem from a governmentuniversity partnership. Steven A. Ackerman Director, CIMSS 3 CIMSS • 2002 CIMSS Participates in International H2O Project Wayne Feltz S evere storms, heat, rain, hail, fog, and Homestead site near Balko, Oklahoma (within the panhandle) and supplemented a wind… Space Science and suite of ground-based radars, lidars, and in Engineering Center (SSEC)/CIMSS scientists from the University of Wisconsin - situ meteorological instruments (Figure 2). Madison experienced it all during participa- The Winnebago is more affectionately tion in the International H2O Project (IHOP, known as the AERIbago because it carries an Atmospheric Emitted Radiance http://cimss.ssec.wisc.edu/ihop/). The Interferometer (AERI) field experiment was boundary layer temconducted from May perature and mois13 - June 25, 2002 ture-profiling instruin Oklahoma, Texas, ment. The AERI proand Kansas (Figure vided near real-time 1). IHOP's three main temperature/moisture areas of meteorologiprofiles, boundarycal interest were conlayer height, and vective initiation, atmospheric stability atmospheric water information in support vapor variability, and of the IHOP campaign. boundary layer development. Over The AERI 30 scientists, engiobserved several interneers, and students Figure 1. Region of interest during IHOP camesting meteorological provided support for paign. White dots indicate locations of IHOP events including cold the ground-based and DOE ARM ground-based validation instrufrontal/dryline pasSSEC Winnebago, ment suites. sages and return flow the airborne moisture from the Gulf of Mexico. Figure 3 Scanning High resolution Interferometer illustrates the diversity of the thermal and Sounder (S-HIS), and the airborne NPOESS moisture structure of the atmosphere with Atmospheric Sounding Testbed a time-height cross section of the potential Interferometer (NAST-I). CIMSS also protemperature and water vapor mixing ratio vided GOES-8/11 and EOS Terra MODIS retrieved from the AERI infrared radiances. satellite-derived products and numerical Precursor stability conditions were moniweather prediction support for the field campaign. Field experiments, such as IHOP, play an important role in the research cycle. Scientists use them to evaluate potential satellite instrumentation on aircraft platforms, validate and calibrate current research and operational satellites, and assess the accuracy of current/new meteorological in situ/remote sensing technologies. CIMSS participates at all these levels - ground based, airborne, and satellite. The UW-Madison Winnebago (pictured on front cover) was located at the IHOP CIMSS • 2002 Figure 2. The IHOP Homestead site instrument suite near Balko, Oklahoma. 4 Madison’s S-HIS and NASA Langley's NAST-I aboard the NASA DC-8 and Proteus aircraft respectively, stationed at Will Rogers airport in Oklahoma City. Each instrument flew over six research missions, including several convective initiation events, mapping the water vapor and temperature structure within the field experiment domain at relatively high spatial, temporal, and vertical resolution. An example of several temperature profiles retrieved from the S-HIS instrument on May 30, 2002 is shown in Figure 4. Both the NASTI and S-HIS instruments are capable of scanning horizontal swaths of infrared radiance (Fig. 5), mimicking future space-based satellite instruments. The data sets will be Figure 3. A time-height cross section of AERI derived potential temperature and water vapor mixing ratio for the entire IHOP campaign period (13 May - 25 June 2002). The white gaps indicate lack of retrieval data due to precipitation or low clouds. tored by the AERI system prior to convective initiation on several occasions. One memorable event occurred on May 23, 2002. A large supercell thunderstorm formed to the southeast of the Homestead site producing a mesocyclone and golf ball sized hail. Participating SSEC/CIMSS scientists had a close encounter with this severe thunderstorm (see large photos on front cover of magazine). High spectral resolution infrared radiances were also measured by UW Figure 5. A display of S-HIS calibrated longwave radiances over the IHOP area of interest. The swath width is approximately 15 km. analyzed to detect precursors to convective initiation within the radiance derived thermal and wind fields. High spectral resolution infrared radiances dramatically improve the vertical resolution of the temperature and moisture profiles as compared to current broadband radiances measured from the GOES and NOAA satellite platforms. Since water vapor and liquid water features can be tracked using radiance measurements, it is possible to calculate wind vector estimates. The enhanced verti- Figure 4. A series of temperature profiles derived from S-HIS infrared radiances on 30 May 2002. 5 CIMSS • 2002 prediction model validation and a wealth of data for simulation of future satellite capabilities. The GOES satellite imagery also provided helpful meteorological navigation for a java-based flight track viewer (http://zonda.ssec.wisc.edu/~ihop/viewer). This viewer allows immediate post-flight analysis, as well as serves as a future resource for efficient selection of case studies from several aircraft instrument suites. In addition to GOES satellite data, real-time EOS Terra MODIS instrument imagery was also provided to the IHOP community. Figure 6. A single field of view (~10 km x 10 km) image of GOES-11 derived lifted index over the IHOP region for 12 June 2002 at 7:46 UTC. A unique data set of high spectral infrared radiances has been obtained from ground based and aircraft interferometers during the IHOP field campaign. These data sets will be essential for showing the potential benefit of future satellite instrument systems to detect the precursors of severe thunderstorm development by monitoring temperature, moisture and wind information. The wealth of information from the IHOP project will provide a solid foundation for SSEC/CIMSS scientists to advance future space-based satellite instrument studies to improve weather prediction and localized severe thunderstorm nowcasting. cal resolution and temporal resolution should provide improved lead time through detection of water vapor convergence and vorticity within the boundary layer prior to cloud development. Along with providing ground-based and airborne high spectral resolution radiances and derived meteorological products, SSEC/CIMSS supported the IHOP campaign with GOES-8 and GOES-11 satellite derived meteorological products. GOES-11 was activated by NESDIS for a three week period in support of IHOP activities. Figure 6 provides an example of a single field of view lifted index derived from the GOES-11 sounder. The GOES-11 imager continuously provided data at five minute temporal resolution during the three week activation period of the experiment. These data should provide excellent numerical weather For more information on CIMSS’s participation in IHOP, please visit our IHOP web page: http://cimss.ssec.wisc.edu/ihop/ Suomi-Simpson Graduate Fellowship Winner Announced Ms. Shaima Nasiri has received this year’s Suomi-Simpson Graduate Fellowship, sponsored by the UW-Madison Department of Atmospheric and Oceanic Sciences, in conjunction with the Earth Sciences Directorate at the Goddard Space Flight Center (GSFC). Named after Dr. Verner Suomi (UW) and Dr. Joanne Simpson (GSFC), the fellowship encourages the type of collaboration represented by these two outstanding scientists. Ms. Nasiri will collaborate with scientists at UW-Madison (Prof. Steve Ackerman) and GSFC (Drs. Steven Platnick and Michael King) as part of her research activities. CIMSS • 2002 6 Wildfire ABBA Goes Operational Elaine Prins S research scientists, resource managers, fire managers, and policy and decision makers nationally and internationally. ince 1995, the GOES Automated Biomass Burning Algorithm (ABBA) has been used to monitor spatial, diurnal, and interannual trends in biomass burning in South America. Recently, NOAA/NESDIS/ORA and CIMSS scientists developed a new Wildfire ABBA (WF_ABBA) processing system for half-hourly monitoring of both agricultural and wild fires throughout the Western Hemisphere in real-time. The WF_ABBA fire product is available over North, Central and South America and is used by climate change In March 2002, the WF_ABBA processing system was transferred to the NOAA NESDIS Office of Satellite Data Processing and Distribution (OSDPD) Satellite Services Division (SSD) in preparation for the system to become operational in August. NOAA NESDIS is incorporating the GOES Wild Fire product into the Hazards Mapping System which provides fire products derived from satellite images to the Geospatial Multi-Agency Coordination group for wild land fire support efforts in the United States. Over the past year the WF_ABBA was able to monitor the rapid intensification of a number of fires in the Western U.S. including the Viejas Fire in California, the Thirty Mile Fire in Washington, the Hayman fire in Colorado (left image), and the Rodeo/Chedesky fire in Arizona (right image). National Weather Service fire weather forecasters have been using the WF_ABBA fire product for over a year. Development of Operational Products at CIMSS The WF_ABBA continues in a tradition of products developed at CIMSS from GOES measurements that are now produced operationally by NOAA/NESDIS. Other operational products include information on: * * * * Atmospheric Motions, Sea Surface Temperature, Atmospheric Moisture/Stability, and Clouds. 7 CIMSS • 2002 Fire Detection with Scanning-HIS Dave Tobin, Steve Ackerman, Paolo Antonelli, Fred Best, Ben Howell, Bob Knuteson, Hank Revercomb, and Ken Vinson F A major goal of SSEC/CIMSS’s participation was to accurately characterize the radiative properties of the atmosphere and surface of the SAFARI experiment region. ires have an obvious impact on the ecology of a region and are an important component of land management. Approaches to detecting fires using satellite observations have concentrated on using multi-spectral imagery at visible, 3.9, 10.7, and 12 micron wavelengths to identify and catalogue fires. This article demonstrates an approach to fire detection that uses high-spectral resolution measurements around 2400 cm-1 (4.2 mm). During the Southern Africa Regional Science Initiative 2000 (SAFARI 2000) experiment (conducted from August 17 to September 25, 2000), several research aircraft were deployed to obtain remote and in situ measurements of the properties of the atmosphere and surface of Southern Africa. Instruments that simulate the capabilities of current and future satellite sensors were flown on the NASA ER-2 aircraft at an altitude of approximately 20 km. Included in this suite of instruments was the University of Wisconsin-Space Science and Engineering Center (UW-SSEC) Scanning-High spectral resolution Interferometer Sounder (S-HIS). During SAFARI SSEC/CIMSS researchers had the opportunity to make measurements of fires and test S-HIS's ability to detect them. Figure 1 shows an example of the fire spectral feature observed during the flight of 7 September 2000 when the ER-2 flew over a controlled fire set by SAFARI personnel. The spectral feature at 2395 cm-1 coincides with the presence of a fire in the S-HIS field-of-view (fov). Figure 2 locates the reference fov on the MODIS Airborne Simulator (MAS) image. The target fire, with its attendant smoke plume, can be clearly observed near the center of the image. A larger, older burn scar lies to the north of the image (see inset). The S-HIS observation path passes directly down the center of the MAS image. Absorption by atmospheric CO2 in the 2300 cm-1 to 2380 cm-1 spectral region (i.e. 4.2 mm to 4.35 mm) is 100 % over long path lengths. Atmospheric transparency becomes large at approximately 2400 cm-1. The fire signature occurs in this transition region between strong and weak absorption. This spectral region has been used to examine hot exhaust plumes, and the observed feature near 2400 cm-1 is referred to as the ‘blue spike’ [Heland and Schäfer 1997]. The cause of the spike is demonstrated through analysis of monochromatic calculations performed using the line-byline radiative transfer model, LBLRTM [Clough et al. 1995]. Figure 3 shows the brightness temperature for the spectral region 2380 cm-1 to 2425 cm-1, for two atmospheric conditions. One calculation is for the standard conditions (lower curve), the second is computed by increasing the air temperature of the lowest 0.25km to 380K, simulating a hot air plume from a fire advected over a non-fire region. In this Figure 1. S-HIS observations of brightness temperature as a function of wavenumber over a fire scene as determined by the MAS observations. The fire feature, or blue-spike, is demonstrated through comparison with a fire-free field-of-view. CIMSS • 2002 8 the band at ~2392 cm-1. Absorption by the cooler layers above the plume in this region (~2390 to ~2397 cm-1) is small, resulting in negligible attenuation of the plume emission. After degrading to the spectral resolution of the instrument, the feature looks like a single “spike.” The fire signature shape and amplitude is a function of the fractional area coverage of three near-surface conditions: fire region, undisturbed region, and the area with no fire on the ground but hot air above. By weighting calculations to match the shape of the fire signature in the 2380-2410 cm-1 spectral region, the fractional area coverage of these three near-surface conditions can be determined. Using a 250 meter 380K plume, these sub-footprint fractional areas were retrieved for the second overpass of the controlled burn, between approximately 8:42 and 8:45 UTC. The fractional coverage of the fire region (hot air over hot surface) and the region of hot air over cooler ground is approximately the same, 10% each, while 80% of the 2 km diameter fov is composed of the undisturbed background. Figure 2. MAS view of the control burn region on 7 September 2000 with the location of the SHIS field-of-view at 08:43:20 UTC. The fire fronts can be seen in the MAS image. The larger view of the region from the MAS is shown in the lower-left RGB image of bands 20, 10, and 2 (2.1, 1.6, .64 mm). case, the presence of the hot lower layer overlying the cooler surface, when combined with the sharp transition in absorption between 2380 and 2400 cm-1 and the temperature dependence of CO2 absorption/emission, gives rise to the observed spectrum. The hot temperature of the plume stimulates more emission throughout the band, including the higher rotational energy lines beyond the normal edge of SSEC/CIMSS researchers are combining S-HIS observations with additional measurements during SAFARI to refine this approach to fire detection and retrieving fire parameters. The long-term goal is to apply this methodology to new satellite instruments, such as the recently launched AIRS. References Clough, S. A. and M. J. Iacono, 1995: Line-byline calculations of atmospheric fluxes and cooling rates. 2: Applications to carbon dioxide, ozone, methane, nitrous oxide and the halocarbons. Journal of Geophysical Research, 100, 16519-16535 Figure 3. Brightness temperature as a function of wavenumber determined from a line-by-line radiative transfer model for a fire free region (lower curve) and a region with hot air (380K) in the lowest 250 m (upper curve). Heland J., and K. Schäfer,1997: Analysis of aircraft exhausts with Fourier-transform infrared emission spectroscopy. Appl. Optics, 36, 49224931. 9 CIMSS • 2002 Summary of the Sixth International Winds Workshop Chris Velden T he Sixth International Winds Workshop (IWW6) was held in Madison, Wisconsin, USA from 7-10 May 2002. The workshop was organized jointly by CIMSS and EUMETSAT (European Organisation for the Exploitation of Meteorological Satellites), with additional support proThe Monona Terrace Community vided by the National and Convention Center, site of Environmental Satellite, Data, the Sixth International Winds and Information Service (NESWorkshop. DIS) and the World Meteorological Organization (WMO). The IWWs provide an established forum for satellite data providers, users and the science community to present advances and exchange ideas on the use and interpretation of atmospheric motion vectors (AMV). They also provide the WMO with a synopsis of AMV advances, issues and recommendations from which action items may be drafted for consideration by the international community. IWW6 was attended by 47 scientists from 13 countries. It is noteworthy that all operational satellite data centers producing AMVs were represented, as were most global numerical weather prediction (NWP) centers. Complementing this was a strong contingent from the AMV research and applications communities. IWW6 opened with a series of welcome addresses by Chris Velden (CIMSS), Johannes Schmetz (EUMETSAT, for Tillman Mohr), Paul Menzel (NESDIS), and Don Hinsman (WMO). The workshop proceeded with six plenary sessions focused on topics relevant to the processing and utilization of AMVs, as well as other satellite-based observing platforms which are producing (or planned to produce) wind information. This was followed by working group (WG) sessions that addressed issues related to three AMV topics: methods, utilization, and verification (including QC). The WGs also considered issues offered by the WMO Coordination Group on Meteorological Satellites. IWW6 concluded with a plenary session that reviewed the WG findings and recommendations. Some of the highlights from IWW6 include: 1) The introduction of AMVs over polar regions from the Terra MODIS data (preliminary NWP impact results are quite encouraging). 2) The advancement in the quality of AMVs derived from INSAT. 3) The addition of a new operational AMV processor: the US Air Force Weather Agency. 4) The exciting new applications of veryhigh-density AMVs derived from rapid scans to mesoscale prediction problems. 5) The successful proliferation and application of the new quality indicators (QI and RFF) by the user community. 6) The prospect of AMVs from space-based lidar profiling missions. The next IWW will be organized by the same scientific committee and is planned for the fall of 2003 in Beijing, China. Suomi Scholarship Award Winners Announced CIMSS is pleased to announce the winners of the fifth annual Verner E. Suomi Scholarship Award for Outstanding Achievement in the Physical Sciences: Seth Bruch of Arrowhead High School (Hartland, WI), Sean McLaughlin of Wauwatosa East High School (Wauwatosa, WI), Kelly M. Sheahan of Neenah High School (Neenah, WI), Adam Varble of Franklin High School (Franklin, WI), Greta Videen of Rice Lake High School (Rice Lake, WI), and Nicholas Zachar of Hudson High School (Hudson, WI). CIMSS • 2002 10 Tony Schreiner was named NOAA Team Member of the Month for June 2002. In particular, Tony was recognized for his work in developing a clearsky brightness temperature product. Clear Sky Brightness Temperatures from the GOES-8 and -10 Imagers Anthony J. Schreiner and Timothy J. Schmit S ince November 2001 CIMSS has been determining Clear Sky Brightness Temperature (CSBT) information from the Geostationary Operational Environmental Satellite (GOES) -8 and -10 Imagers. These observed data are provided to the National Center for Environmental Prediction (NCEP) and the European Centre for Medium-range Weather Forecasts (ECMWF) for assimilation into global weather prediction models. Processing frequency is hourly and hemispheric. Coverage for the CSBT extends from roughly 67S to 67N and 30W to 165E. The resolution is averaged over boxes of approximately 50 km. Each box consists of 187 (eleven rows by 17 columns) fields-of-view (fovs). For a given box a cloud detection algorithm is used (Schreiner et al. 2001). This clear/cloudy mechanism is based on comparisons to brightness temperatures with its neighbors and surface information provided by hourly observations where available and numerical forecasts and remotely sensed sea surface temperatures over the oceans. For each 50 km box the average brightness temperature for each infrared (IR) band and the albedo for the visible band are calculated along with the average clear and cloudy brightness temperatures. Additional parameters are the number of clear and cloudy fovs, center latitude and longitude of the box, center local zenith and solar zenith angles of the box, land/sea flag, standard deviation of the average clear and cloudy brightness temperatures, and two quality indicator flags. The processing is performed using the Man computer Data Interactive Access System (McIDAS). In addition to the averaged output data, single fov information is also generated. Figure 1 is a composite image of the GOES-8 and -10 Imager for the 11.0 mm (Long Wave Window) band for 12 March 2002 at 15 UTC. Figure 2 is a CSBT single Figure 1. Combined GOES-8 and -10 Imager 11.0 mm (Long Wave Window) band for 12 March 2002 at 15 UTC. fov output image for the 6.7 mm (Water Vapor) band from the GOES Imager, also for 12 March 2002 at 15 UTC. The blue to green colored portion of Figure 2 shows the clear fov brightness temperatures. The "gray mask" denotes the cloudy fovs. This single fov product is useful for determining the effectiveness of the cloud detection algorithm. These averaged CSBT are currently Figure 2. Combine GOES-8 and -10 Clear Sky Brightness Temperature image of the 6.7 mm (Water Vapor) band for 12 March 2002 15 UTC. Grey indicates cloud and white through dark red indicate clear. 11 CIMSS • 2002 being collected, decoded, evaluated, and for limited cases are being assimilated into global numerical weather prediction models. ECMWF performed a preliminary evaluation of the GOES Imager CSBT and found the water vapor channel (band 3, 6.7 mm) to be of good quality. An example of a quality test is shown in Figure 3. Note that there is very little variation with local zenith angle (Figure 3B). The change of the slope for the Observed minus Forecast versus the Percentage of Clear fovs per box is nearly flat (Figure 3A). Additional quality control tests by NCEP of the averaged CSBT for the long wave window channel (band 4) have indicated some deficiencies in the cloud detection algorithm. One example demonstrated how incorrectly identified clear fovs were slipping through, when in fact they were cloudy. This deficiency was remedied. NCEP will investigate assimilating these data every six hours. ECMWF, using the hourly data, generated forecasts using the CSBT data and early indications show positive impact. Both NCEP and ECMWF are using data only over the oceans. Plans call for this processing system to be transferred to the NESDIS/ Office of Satellite Data Processing and Distribution. Once processing begins, this data set will become one of the suite of real-time operational products resulting from the GOES. Two upgrades in the processing system are also planned. One is an improvement to the cloud detection technique. The current cloud detection technique will flag all bands for a particular fov. This may be true for the three "Window" bands (4.0 mm, 11.0 mm, and 12.0 mm), but the Water Vapor band may in fact be clear, especially with low-level clouds (i.e., cumulus level). The second potential upgrade is to expand the product to the Japanese Geostationary Meteorological Satellite (GMS) data. By incorporating CSBT data from the GMS, along with the CSBT information already being operationally generated from the CIMSS • 2002 Figure 3. Preliminary comparison of averaged CSBT boxes (OBS) with a background guess (FG). (A) OBS-FG vs. Local Zenith Angle. (B) OBS-FG vs. Percent of Clear Pixels. Courtesy of Christina Koepken, 2001 ECMWF. European Meteorological Satellite (Meteosat) data a truly operational, global, hourly radiance product will be feasible. By inserting these hourly, globally produced CSBT data sets into numerical weather prediction models, improved global forecasts will result. Reference Schreiner, A. J., T. J. Schmit, and W. P. Menzel, 2001: Observations and trends of clouds based on GOES sounder data. Journal of Geophysical Research-Atmospheres, 106, 20,349-20,363. 12
