Volume 2 2001 University of Wisconsin-Madison First GOES-12
advertisement
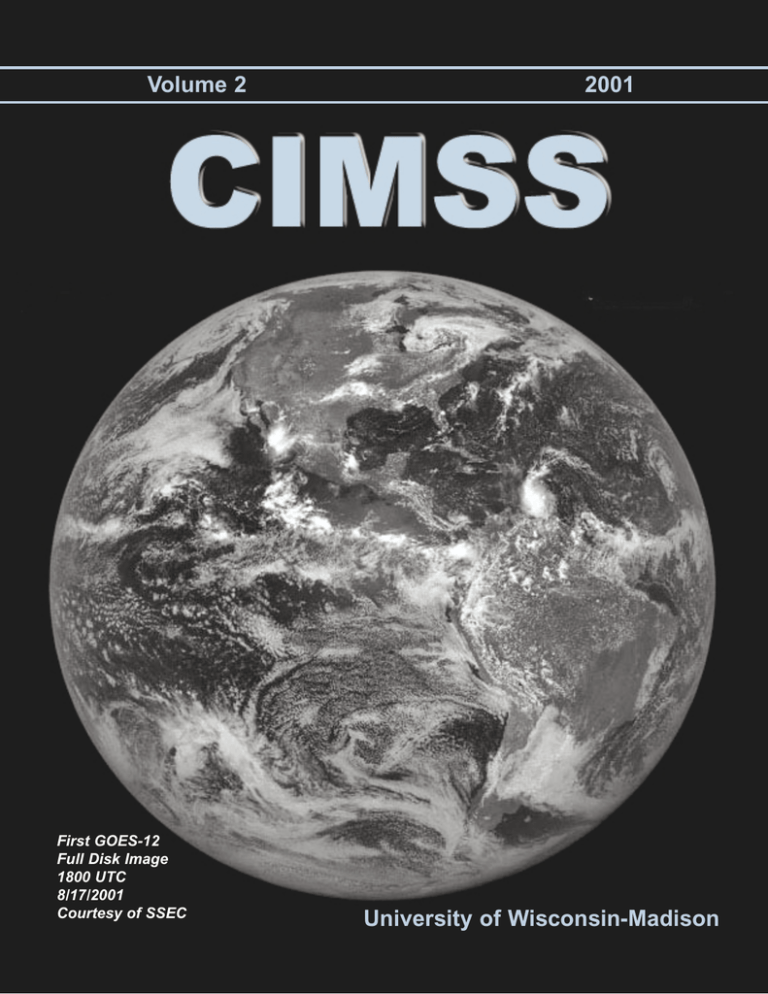
Volume 2 First GOES-12 Full Disk Image 1800 UTC 8/17/2001 Courtesy of SSEC 2001 University of Wisconsin-Madison Note from the Director T he CIMSS mission consists of three goals: The first article summarizes some of our many collaborations with NOAA scientists. The emphasis of this article is our research with observations from geostationary satellites and our ability to transfer this research to NOAA operations. Demonstrating that CIMSS and SSEC research serves as a focal point for other scientists, the second article summarizes collaborations that address validation and calibration of satellite measurements and derived products. The final article provides examples of our education activities that focus on research collaborations with undergraduate students. · To foster collaborative research among NOAA, NASA, and the University of Wisconsin-Madison in those aspects of atmospheric and earth system science that exploit the use of satellite technology. · To serve as a center at which scientists and engineers working on problems of mutual interest can focus on satellite related research in atmospheric and earth system science. · To stimulate the training of scientists and engineers in the disciplines involved in atmospheric and earth sciences. These three articles are a small sampling of the work conducted at CIMSS. If you are interested in learning more - come visit! To achieve this mission CIMSS conducts a broad array of activities. The purpose of this newsletter is to provide a glimpse of how CIMSS activities support our mission. Steven A. Ackerman Director, CIMSS Table of Contents GOES Sounder and Imager Science ................................................................................3 Calibration and Validation Using the ARM CART Sites....................................................7 Research Collaborations with Undergraduate Students ..................................................8 CIMSS Board of Directors Martin Cadwallader, Steve Ackerman, Hank Revercomb, John Young, Gregory Withee, Marie Colton, Jeff Key, Ghassem Asrar, Leonard McMaster, Franco Einaudi CIMSS Scientific Advisory Council Steve Ackerman, Allen Huang, Chris Velden, Jon Martin, John Norman, Arnie Gruber, Fran Holt, Robert Ellingson, Graeme Stephens, Pat Minnis Editor: Leanne Avila Original Design by Betsy True Revised by Leanne Avila CIMSS Cooperative Institute for Meteorological Satellite Studies University of Wisconsin-Madison 1225 W. Dayton St. Madison, WI 53706 608-263-7435 http://cimss.ssec.wisc.edu/ CIMSS • 2001 2 GOES Sounder and Imager Science Thomas Achtor CIMSS The GOES Sounder contains 18 infrared (IR) and 1 visible band. The IR spectral coverage extends from 3.7 to 14.7 µm (2700 to 700 cm-1) and provides for the determination of vertical characteristics of the atmosphere. The 10 km spatial resolution currently provides coverage each hour over a domain that includes the continental U.S. and near offshore regions. That coverage is adjusted during the Atlantic Hurricane season to expand south and east into the Caribbean. Figure 1 shows the GOES Sounder hourly coverage and the GOES Sounder Total Precipitable Water product. Where a retrieval is made, the color enhanced PW values are displayed; where no retrieval is made, the gray scale IR window brightness temperature is displayed. has pioneered the development of retrieval techniques, applications and visualization of NOAA satellite sounding and imaging data. Smith and Hayden conducted early work in sounding science from several research instruments in polar orbit and the VISSR (Visible and Infrared Spin-Scan Radiometer) Atmospheric Sounder (VAS) in geostationary orbit (Smith 1983; Hayden 1988). Success in this early work and a desire to transfer successful research ideas into operations led to the formation of the Cooperative Institute for Meteorological Satellite Studies (CIMSS) at the University of Wisconsin Madison (UW). The ability to transfer technology into operations is strongly enabled by the presence of the NOAA NESDIS ORA (Office of Research and Applications) Advanced Satellite Products Team in Madison. UW and NESDIS scientists work side by side at CIMSS seeking optimal use of GOES, as well as POES, data in weather analysis and forecasting. The GOES Imager visible channel has a 1 km spatial resolution, while the four IR channels have a 4 km nominal resolution (the water vapor band resolution was 8 km prior to GOES 12). GOES-12 supports a Figure 1: GOES Sounder combined Total Precipitable Water product for 1300 UTC on 2 November 2001. 3 CIMSS • 2001 13.3 µm band in place of the 12 µm band (Schmit et al. 2001b). The Imager covers 3/5th of the western hemisphere full disk every 15 minutes, but can also be put into Rapid Scan modes, achieving up to 1 minute temporal resolution. tive transfer model to calculate model brightness temperatures, and then compares them with bias adjusted - observed brightness temperatures. The difference in the calculation and observation is the information used to adjust the first guess to a final solution. More detail can be found in Ma et al. 1999, Li et al. 1999, or on line at CIMSS scientists are involved in several programs researching retrieval methods from the GOES Sounder (S) and Imager (I). They include: temperature and moisture (S), ozone (S), cloud amount and cloud top pressure / altitude (S and I with GOES 12), sea surface temperature (I), surface biomass burning (I), atmospheric aerosol amount (I) and cloud and water vapor motion derived winds (I and S). For many of these retrieval methods, the products are also transformed to an image format, referred to as Derived Product Imagery (DPI). DPI products include Total Precipitable water, Lifted Index and Convective Available Potential Energy (stabiliFigure 2: GOES Total Precipitable Water image with retrieval minus guess plot. ty), Cloud Top Pressure, Ozone and SST. There are numerous real time examples and anihttp://cimss.ssec.wisc.edu/sounder/ mations of these products on line at profinfo.html or http://cimss.ssec.wisc.edu/. http://cimss.ssec.wisc.edu/goes/comet/ . Thermodynamic Retrieval Figure 2 provides a significant amount of insight into the retrieval process and what users can easily view from the output. The image, taken from on on-line Java applet, is a combined GOES East and West Sounder Precipitable Water product. In Figure 2 the difference between the PW model-based first guess and final retrieval is displayed. The image indicates a The CIMSS thermodynamic retrieval algorithm uses a simultaneous, physically based algorithm to produce surface skin temperature and emissivity, vertical profiles of temperature and moisture, and cloud amount, cloud top temperature and pressure (height). The methodology uses a numerical model first guess and fast radia- CIMSS • 2001 4 Southwestern U.S. monsoon surge bringing high moisture values into Arizona. The difference plot shows that the PW retrieval has moistened the initial guess by up to 9 g/kg over northern Arizona and dried the initial guess by up to 10 g/kg over Baja California. Thus, the figure displays a GOES Sounder DPI, indicates the retrieval coverage, and demonstrates the ability of the GOES retrieval algorithm to significantly modify the initial guess based on GOES Sounder radiances. Three layers of retrieved precipitable water from the GOES sounders continue to be assimilated into the operational NCEP regional (Eta) model (Schmit et al. 2001a). SST The GOES Sea Surface Temperature (SST) algorithm is developed from a statistical regression between collocated GOES Imager radiances and SST measurements from NOAA buoys. The algorithm uses GOES radiances from bands 4 (11 µm) and 5 (12 µm), and Band 2 (3.9 µm) at night. Careful cloud screening is done to obtain radiances from only clear fields of view. The 4 km resolution SST calculations are generated every three hours. Once a day, around 1600 UTC, a composite image is produced from the three-hourly SST images. The geostationary perspective provides frequent viewing, which permits improved spatial coverage with time as clouds move in and out of any particular region. This product is now being produced operationally by NESDIS in Washington, DC. Clouds Cloud amount, and cloud top temperature and pressure are additional products from the simultaneous physical retrieval algorithm. Where temperature and moisture retrievals cannot be produced, the CO2 absorption technique (Schreiner et al. 2001) is applied to a single Sounder field of view to retrieve the cloud products. Recently modelers and forecasters noted the cloud product height assignment was erroneously high over the Eastern Pacific, especially in regions of maritime inversion. With this feedback, CIMSS studied and then implemented a new method for marine stratus height assignment in NESDIS operations. Winds At CIMSS, software has been developed and evolved that derives atmospheric wind vectors from the motion of tracers in visible, IR window and water vapor imagery (Nieman et al. 1997). This work is primarily from the GOES Imager, given its higher spatial and temporal resolution, although winds from the GOES Sounder water vapor bands are also produced. This algorithm is based on three steps: tracer identification, wind vector calculation and quality control. The tracer identification procedure has evolved over the past 20 years from a human identifying tracers into today's fully automated algorithm. The quality control procedure has also undergone a significant transformation and now uses a first guess as control and outputs wind accuracy confidence information (Velden et al. 1997). Figure 3 shows the coverage over the Atlantic basin from the current High Density Wind Algorithm. Collaborative work using GOES winds in tropical storm Ozone The Total Column Ozone retrieval is independently generated from GOES Sounder data by application of a regression algorithm (Li et al. 2000). Ozone estimates are currently created in cloud-free and partly cloudy regions of the GOES-8 and 10 Sounder sectors. An hourly Derived Product Image of Total Ozone is also produced. This product allows, for the first time, high temporal observations in real time over large areas to better understand ozone dynamics. 5 CIMSS • 2001 analysis has been ongoing with the NOAA Tropical Prediction Center (TPC) in Miami for many years. CIMSS and TPC recently collaborated on a student intern program, during which a UW graduate student spent two summers at TPC working on a satellite wind product for use in the TPC surface analysis. It has been shown in a number of forecast models that these winds improve the forecasts, a fact which has been documented in several refereed journal articles using a number of models (GFDL, Navy NOGAPS, RUC, and ECMWF). in which the smoke pall from fires is easily seen, and from the 3.9 µm band, where dark pixels indicate fires. The GOES Automated Smoke/Aerosol Detection Algorithm (ASADA) incorporates multi-spectral Imager data including the visible, 3.9, 10.7, and 12µm data to map smoke and other aerosols (Prins et al. 1998). The GOES ASADA products include composite imagery and grids that provide a summary of the extent of smoke/aerosol coverage, and smoke albedo estimates that give a general indication of the smoke intensity. Biomass Burning CIMSS also conducts studies in numerical model data assimilation in collaboration with the NOAA National Centers for Environmental Prediction (NCEP) to provide advice on using GOES observations and products in the analysis portion of numerical forecast models. Strong collaborations over the past few years have provided for expanded use of GOES moisture, cloud and winds information in NCEP operational models. Ongoing studies are evaluating the impact of GOES soundings, winds and cloud properties on numerical models using the workstation Eta. These studies have shown that a positive forecast impact is achieved from assimilating several types of satellite data. CIMSS scientists have developed algorithms that detect and monitor fires at the Earth's surface and that locate and track aerosols associated with the burning. The Automated Biomass Burning Algorithm (ABBA) uses the GOES Imager visible, 3.9, and 10.7 µm data in cloud-free conditions to locate fire pixels and provides estimates of the sub-pixel area and mean temperature of the fire(s) (Prins and Menzel 1992, 1994). Figure 4 shows an image from the visible, The final task for successfully developed techniques and products is to transfer the software into operations through collaboration with the NESDIS Forecast Products Development Team (FPDT; see http://orbitnet.nesdis.noaa.gov/arad/fpdt/). While FPDT tests and implements the software into NESDIS operations, CIMSS continues its research work on improving to the algorithms and developing new techniques. This research to operations collaboration has been ongoing for over 20 years and continues to serve as the foundation of a strong research partnership between the UW Figure 3: GOES Imager high density winds for 1200 UTC on 1 November 2001. CIMSS • 2001 6 and NOAA. Schmit, T. J., E. M. Prins, A. J. Schreiner, and J. J. Gurka, 2001b: Introducing the GOES-M imager. Accepted by Nat. Wea. Assoc. Digest. References Smith, W. L., 1983: The retrieval of atmospheric profiles from VAS geostationary radiance observations. J. Atmos. Sci., 40, 2025-2035. Hayden, C. M., 1988: GOES-VAS simultaneous temperature-moisture retrieval algorithm. J. Appl. Meteor., 27, 705-733. Schreiner, A. J., T. J. Schmit, and W. P. Menzel, 2001: Observations and trends of clouds based on GOES Sounder data. J. Geophysical Res. Atmospheres, 17, 20,349-20,363. Li, J., and H.-L. Huang, 1999: Retrieval of atmospheric profiles from satellite sounder measurements by use of the discrepancy principle. Appl. Opt., 38, 916-923. Velden, C. S., C. M. Hayden, S. Nieman, W. P. Menzel, S. Wanzong, and J. Goerss, 1997: Upper-tropospheric winds derived from geostationary satellite water vapor observations. Bull. Am. Met. Soc., 78, 173-195. Li, J., C. Schmidt and J. Nelson, 2000: Estimation of total atmospheric ozone from GOES Sounder radiances with high temporal resolution. J. Atm. and Ocean Tech., 18, 157168. Ma, X. L., T. J. Schmit, and W. L. Smith, 1999: A nonlinear physical retrieval algorithm-Its application to the GOES-8/9 sounder. J. Appl. Meteor., 38, 501-513. Nieman, S. J., W. P. Menzel, C. M. Hayden, D. Gray, S. Wanzong, C. S. Velden, and J. Daniels, 1997: Fully automated cloud-drift winds in NESDIS Operations. Bull. Am. Met. Soc., 78, 121-1133. Prins, E. M., J. M. Feltz, W. P. Menzel, and D. E. Ward, 1998: An overview of GOES-8 diurnal fire and smoke results for SCAR-B and the 1995 fire season in South America. J. of Geophys. Res., 103, 31821-31836. Prins, E. M. and W. P. Menzel, 1992: Geostationary satellite detection of biomass burning in South America. Int. J. of Remote Sensing, 13, 2783-2799. Prins, E. M. and W. P. Menzel, 1994: Trends in South American biomass burning detected with the GOES visible infrared spin scan radiometer atmospheric sounder from 1983 to 1991. J. Geo. Res., 99, 16,719-16735. Figure 4: Depiction of South American fires (lower left) and small pall (upper right) from GOES imagery. Schmit, T.J., 2001a: Validation and use of GOES Sounder moisture. In press. Weather and Forecasting.[on-line version ftp://suomi.ssec.wisc.edu/pub/waf2001/] All GOES products mentioned in this article are available on the CIMSS Web: http://cimss.ssec.wisc.edu 7 CIMSS • 2001 Calibration and Validation Using the ARM CART Sites Leanne Avila, Wayne Feltz, and Dave Tobin Locations of North Slope and SGP ARM sites epartment of Energy (DOE) Atmospheric Radiation Measurement (ARM) data provide a valuable source of continuous ground-based validation for satellite radiances and atmospheric products. Since its creation in 1989, the ARM program has developed and operated measurement sites at three locations: Southern Great Plains (SGP, Oklahoma/Kansas region), North Slope of Alaska (near Barrow, Alaska), and Tropical Western Pacific. Each facility consists of a suite of ground-based in situ and remote sensing instrumentation with the goals of improving knowledge of cloud radiative flux (shortwave and longwave) and developing new General Circulation Model parameterizations to improve climate model forecasts. D Atmospheric Emitted Radiance Interferometer (AERI) and a Raman Lidar. Developed by CIMSS and SSEC scientists and engineers, the AERI measures downwelling infrared radiation to produce temperature and water vapor profiles within the atmospheric boundary layer, surface temperature and emissivity, cloud properties, and trace gas amounts. The first AERI was deployed at the central facility in Lamont, OK, and an additional four were deployed at the SGP boundary facilities. The Raman Lidar is an active, laser remote sensing system measuring vertical profiles of watervapor mixing ratio, as well as a variety of cloud and aerosol parameters. Both the AERIs and Lidar operate continuously at the CART site. Over the years CIMSS scientists have been using data from these ARM Cloud and Radiation Testbed (CART) sites to validate products from our own groundbased instruments at the sites, from operational satellites (GOES), and more recently from new and upcoming research satellites (MODIS and AIRS), resulting in research that has captured the interest of colleagues. Through its parent organization, the Space Science and Engineering Center (SSEC), CIMSS has access to a real-time direct broadcast downlink capability for the GOES and MODIS data. CIMSS produces atmospheric derived products from GOES and MODIS radiances, providing information about atmospheric stability, cloud properties, and moisture. Participation within the ARM program and the development of satellite atmospheric derived products have allowed independent, high temporal resolution validation of satellite radiances and value added products. The first step in using these high time resolution remotely sensed data is to validate the data streams against one another. The DOE ARM program has provided the opportunity to compare derived water vapor profiles to one another for validation. RMS differences between the Raman Lidar and AERI water vapor mixing ratio were determined to be approximately 5%. Figure 1 shows a comparison of AERI and Raman Lidar measurements for a dryline passage on 13 April 1998. This validation is important for two purposes. First, it provides an estimate on the AERI derived water vapor measurements at four other systems placed within a grid that represents one GCM cell. Second, it provides an example of interferometer derived atmospheric state data and error characteristics. Satellite-based Instruments GOES Groundbased Instruments GOES-8 sounder cloud top pressure measurements have been compared to cloud top height measurements derived from a ground- AERI and Raman Lidar Among the groundbased instruments located at the ARM SGP CART site are the CIMSS • 2001 8 Location of Tropical Western Pacific ARM site examining the variance of GOES cloud top altitudes within the 9 pixels observed. If the range between cloud tops were greater than 2 km, the samples were removed. After eliminating multiple cloud levels, the comparison shows high correlation coefficients (>0.9) between the two independent groundbased and satellite based measurements. The results of this comparison for one month are shown in the next article. This preliminary study of GOES sounder cloud top pressure and MPL/MMCR derived cloud boundary values is being extended to a one year period. based combination Micropulse Lidar/Millimeter Cloud Radar (MPL/MMCR) at the SGP site. The MPL/MMCR data were taken from the March 2000 Intensive Operational Period (IOP) at the SGP. Hourly cloud top pressure measurements from the sounder were first converted to height using radiosondes launched within six hours. These sounder cloud height measurements were compared to time averaged MPL/MMCR cloud top heights. Due to the high temporal and spatial resolution of the DOE ARM cloud boundary product, five minute binning of this product on either side of an hourly GOES determined cloud top was done to minimize resolution discrepancies between the ground-based and space-borne cloud top determination. MODIS MODIS radiance validation is being conducted in near real-time by using a best estimate of atmospheric state derived from multiple DOE ARM data streams. These ARM data (includes data from sondes, the Microwave Radiometer, AERI, and Raman Lidar) are collected to coincide with the MODIS overpass. The atmospheric state (pressure, temperature, and water vapor) and uncertainties are created. Scientists are currently using a simplified algorithm that uses only the closest sonde. ARM site surface temperature and emissivity estimates are created; the sondes supply a near surface temperature while AERI measurements provide weighted averages of pure surface type emissivities. The data were filtered to ensure that only single layer cloud decks were compared. Screening was accomplished by Forward calculations using the Line-By-Line Radiative Transfer Model and the best estimate of temperature and moisture are used and compared to MODIS radiances corrected using the MODIS Spectral Response Functions. Figure 2 shows one of these comparisons. Figure 1: Time-height cross sections of water vapor mixing ratio derived from an AERI instrument and a collocated Raman Lidar during a dryline passage on April 13, 1998 at the ARM SGP central facility near Lamont, Oklahoma. 9 A MODIS radiance validation effort is ongoing to assess MODIS channel radiance calibration. CIMSS • 2001 AIRS The Atmospheric Infrared Sounder (AIRS), a high spectral resolution grating spectrometer to be launched on the EOS Aqua platform, is the first of the "advanced sounders." Its sounding products are expected to have high accuracy (1K in layers 1km thick and humidity at an accuracy of 20% in layers 2km thick in the troposphere). CIMSS has been involved in AIRS science research through Hank Revercomb who serves as an AIRS science team member. As part of these activities, CIMSS per- sonnel are developing algorithms to validate the temperature and water vapor profiles retrieved from AIRS using measurements from the ARM sites. Drawing on experience from an ongoing effort to characterize ARM temperature and water vapor measurements, our validation algorithms will combine data from a wide range of ARM sensors to provide best estimates of the surface parameters and temperature and water vapor profiles at the satellite overpass times. These products will then be compared to the AIRS retrievals to assess their accuracy. ARM measurements used in the algorithm include radiosonde profiles, AERI+ retrievals, microwave radiometer measurements of integrated column water vapor, Raman Lidar water vapor profiles, and various cloud measurements, as well as geostationary retrievals and model fields. AIRS is planned for launch in calendar year 2002. Through these varied research activities CIMSS and SSEC provide a focal point for expertise in instrument calibration and data analysis. Figure 2: A plot comparing a full Line-By-Line Radiative Transmittance Model (LBLRTM) brightness temperature calculation and MODIS brightness temperature. CIMSS • 2001 10 Research Collaborations with Undergraduate Students Steven Ackerman S ince its founding in 1980, CIMSS has sought the participation of students in its research programs. Most notably, our graduate students have played a major role in advancing our understanding of weather and climate. CIMSS supports ten to fifteen graduate students each year in research activities that range from exploring new methods of remote sensing to data assimilation. Perhaps less known is our work with undergraduate students. Participating in a research program is a valuable experience for an undergraduate student. Research stimulates curiosity and develops a passion for discovery. By working with CIMSS scientists, undergraduate students are able to engage in collaborative thinking and become engaged with other scientists in research activities that address problems relevant to the student. Approximately six undergraduate students work with CIMSS scientists on various projects. The research of two undergraduate majors in the UW Department of Atmospheric and Oceanic Sciences who recently collaborated with CIMSS scientists is summarized below. Both projects were presented at the AMS 11th Conference on Satellite Meteorology and Oceanography (October 2001). Robin Tanamachi worked closely with the high-spectral resolution group in CIMSS and SSEC (Von Walden and Bob Knuteson in particular) in completing her senior thesis Data Quality Control and Preliminary Data Analysis from the Interferometric Monitor for Greenhouse Gases (IMG) Data Set. Her thesis explored the Interferometer for Greenhouse Gases (IMG) data set, some of its associated data quality issues, and some of the preliminary data products derived from it. Robin developed a series of quality checks on the IMG data that resulted in a series of data-quality flags. With this revision, the IMG data set allowed her to conduct some preliminary scientific investigations. Her work demonstrated that the spatial coverage of the IMG data appears to be adequate for large-scale studies of circulation features over the polar regions, but inadequate for tropical convection. She also used the data to derive surface emissivity of various land surfaces. Following the work of Knuteson et al. (2001), Robin used radiances on and off absorption lines to derive the surface spectral emissivity, en. The approach is based on the knowledge that the surface emissivity should be approximately constant across an absorption line. The emissivity is derived by adjusting the surface temperature and emissivity until the spectral absorption feature is removed from the data. Emissivity histograms were derived for the clear-sky observations over three geographic regions. As shown in Figure 1, the surface emissivities increase from 0.80 over the Sahara Desert, to 0.90 over the subSaharan transition zone, to near unity over Figure 1: Histograms of emissivity at 1200 cm-1 for three geographic regions in Africa. 11 CIMSS • 2001 the Congolese rain forest. James Hawkinson, working closely with Wayne Feltz and Tony Schreiner, used Atmospheric Radiation Measurement (ARM) observations to validate satellite derived cloud top distributions that are routinely produced at CIMSS. Cloud top pressure estimates are available in real-time each hour from analysis of the GOES-8 Sounder. Validation data comes from the March 2000 Intensive Operational Period (IOP) from the Department of Energy's (DOE) ARM Cloud and Radiation Testbed (CART) site near Lamont, OK. This includes cloud top height derived from a ground-based combination Micropulse Lidar/Millimeter Cloud Radar (MPL/MMCR), which uses an algorithm developed by Eugene Clothaiux at Penn State. The MPL/MMCR data were composited to represent the GOES observations. Figure 2 shows a correlation between the GOES and MPL/MMCR observations for the March IOP for single layered clouds. The agreement is very good, r=0.93 with a mean bias of less than 1 km. This work provides a methodology for routine comparisons between satellite and ground-based methods of estimating cloud altitude. CIMSS actively engages students in research that stimulates curiosity and develops a passion for discovery. The pursuit of knowledge and understanding through research is the common goal that binds us as a CIMSS community. Reference Knuteson, R. O., B. Osborne, J. Short, H. Revercomb, D. Tobin, S. Nasiri, 2001: Progress towards a characterization of the infrared emissivity of the land surface in the vicinity of the ARM SGP Central Facility: Surface (S-AERI) and airborne sensors (NAST-I/S-HIS). Presentation to the 11th Annual ARM Program Science Team Meeting, March 19-23, 2001, Atlanta, GA. Figure 2: A comparison of cloud pressure altitude as determined from observation from the GOES satellite and a combination of lidar and radar. Each symbol, as shown in the legend, represents the variation in cloud heights in an area around the ARM site. CIMSS • 2001 12
