University of Wisconsin-Madison Volume 1 2001
advertisement
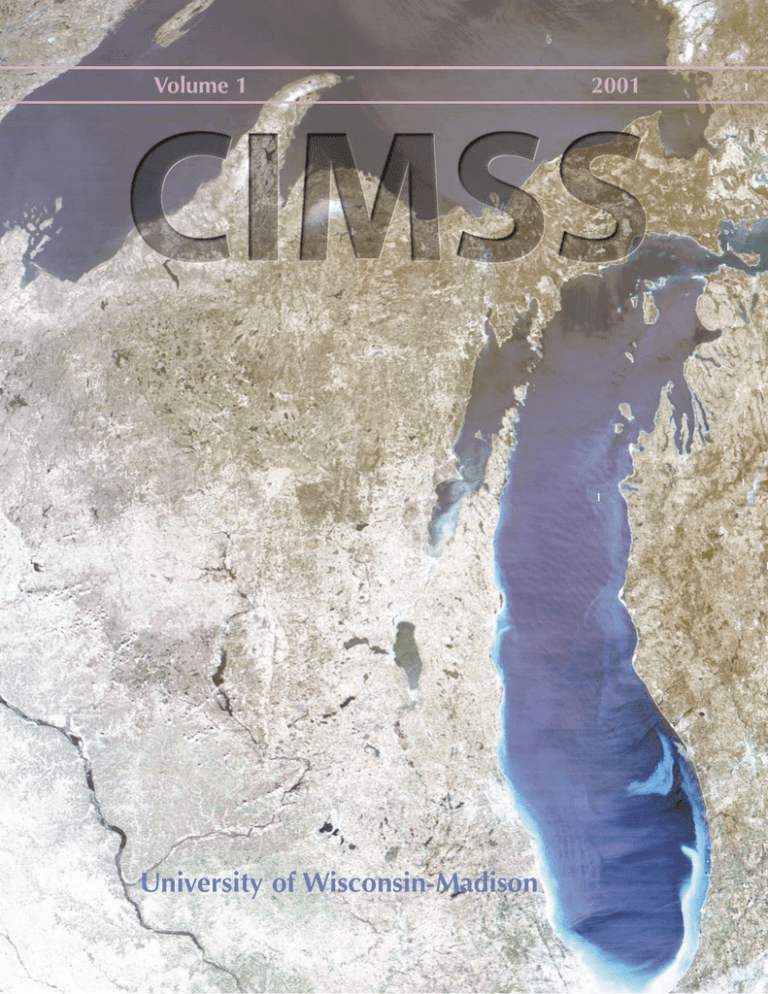
Volume 1 University of Wisconsin-Madison 2001 CIMSS Mission spacecraft and ground-based weather observing systems as part of a national program to improve weather forecast capabilities for the next decade. The optimal use of satellite data in climate and global change studies has become another essential part of our mission. CIMSS is a joint University of Wisconsin, NASA, and NOAA institute, officially created through a Memorandum of Understanding, to provide for cooperative research on the applications of earth orbiting satellites to the observations of the earth’s surface and atmosphere and their application to the analysis and prediction of weather and climate. CIMSS has been implemented within the Space Science and Engineering Center (SSEC) at the University of Wisconsin-Madison. From these investigations CIMSS researchers identify new observations necessary to understanding the earth’s atmosphere and work to develop new measurement concepts, leading to a major role in instrument design and testing, and related software development, for improved spacebased measurements. CIMSS is very active in national and international field programs, testing new instrumentation and data processing systems, and assessing the usefulness of the new data. CIMSS is a world class center conducting research on weather and climate through the interpretation and use of operational and experimental satellite observations and remote sensing data acquired from aircraft and the ground. These data are applied to a variety of atmospheric and oceanographic studies and evaluated for their potential operational utility. CIMSS works with NOAA to transfer these new useful technologies into operational practice. CIMSS serves as a collaborative training ground through its visiting scientist program, hosting several foreign scholars each year, and through its relationship to the UW-Madison Department of Atmospheric and Oceanic Sciences, providing graduate student research support to more than ten students per year. Current research also focuses on the development and testing of computer-based analysis and forecast techniques that use observations from existing and planned CIMSS Board of Directors Virginia Hinshaw, Steve Ackerman, Hank Revercomb, John Young, Gregory Withee, James F. W. Purdom, Jeff Key, Ghassem Asrar, Leonard McMaster, Franco Einaudi CIMSS Scientific Advisory Council Steve Ackerman, Allen Huang, Chris Velden, Jon Martin, John Norman, Arnie Gruber, Fran Holt, Robert Ellingson, Graeme Stephens, Pat Minnis Editor: Leanne Avila Designer: Betsy True CIMSS Cooperative Institute for Meteorological Satellite Studies University of Wisconsin-Madison 1225 W. Dayton St. Madison, WI 53706 608-263-7435 http://cimss.ssec.wisc.edu/ CIMSS • 2001 2 Note from the Director A s CIMSS enters its third decade, it continues to be a world class research center. This greatness arises from our working together unselfishly as a research family, our respect and appreciation for one another, and our sharing of knowledge with each other, students and visitors. The close relationship between CIMSS and SSEC, and our partnering with NOAA and NASA, keeps us actively involved with new satellite systems including GIFTS, ABI, algorithms theory modeling INFORMATION Our work is a process that transforms data into information that becomes knowledge about how the atmosphere behaves. With a better understanding of the atmosphere, we identify needed observations and then develop new instruments that provide unique data sets that provide further information about our world enabling improved predictions. This process is represented in the accompanying figure. Throughout CIMSS’s 20-year history, our scientists have followed this path, continually identifying new measurement capabilities needed to explore the atmosphere. This is where our close relationship with SSEC becomes obvious. Working with SSEC engineers and scientists has led to HIS, S-HIS and AERI, instruments that CIMSS scientists routinely use to probe the atmosphere and develop new algorithms that describe its condition. DATA EDUCATION KNOWLEDGE ACTION new instruments applications ABS and NPOESS. Finally, at the center of this process is education…of ourselves, our students, and the public. In the following pages you will see how we have been progressing through this evolutionary process in a number of research areas. Our ability to work together along this path ensures that CIMSS will remain at the forefront of satellite studies. Steven A. Ackerman Director, CIMSS Table of Contents MODIS Pays Off For CIMSS ............................................................................................4 SAFARI-2000 ..................................................................................................................7 Using Geostationary Satellites to Detect and Monitor Biomass Burning ..........................8 CIMSS Researchers Lead Inter-Agency Study of Upper Level Water Vapor ....................11 A recent CIMSS modeling study ....................................................................................14 The VISIT Program at CIMSS ........................................................................................16 The Summer Workshop in Atmospheric, Earth and Space Sciences ..............................18 3 CIMSS • 2001 MODIS Pays Off For CIMSS Liam E. Gumley other MODIS science team members were regularly deploying the MODIS Airborne Simulator (MAS), an imaging spectrometer with 50 spectral channels that flies on the NASA ER-2. The MAS proved crucial in providing MODIS-like datasets that were used for developing prototype MAS algorithms. In addition, cloud algorithms developed by Paul Menzel, Steve Ackerman, Rich Frey, and Don Wylie at CIMSS using polar orbiting HIRS and AVHRR data were to prove invaluable in preparing for MODIS. I t all began in the late 1980s when NASA embarked on an ambitious ‘Mission to Planet Earth’ to take the pulse of the planet. Polar orbiting sun-synchronous satellites the size of schoolbuses were envisioned, crammed with every kind of passive and active remote sensing device imaginable. Known as the Earth Observing System (EOS), a 15 year series of morning and afternoon satellites (AM-1, PM-1, AM-2, PM2) were planned. In those heady days Paul Menzel proposed to join the science team for the Moderate Resolution Imaging Spectroradiometer (MODIS), an imager that was planned to have both nadir viewing (MODIS-N) and tiltable (MODIS-T) sensors. Paul was approved for a study contract for 1990-1991, and became a member of the science team in 1992 (from January 1992 to December 2000 the project brought in five million dollars of NASA funding to CIMSS and SSEC). By the mid 1990s, the tiltable MODIS-T sensor had been eliminated due to budgetary constraints, and the EOS satellites had been pruned to smaller platforms with only AM and PM spacecraft in the launch schedule. MODIS-N was now known as MODIS, and was to be an imager with 36 spectral bands at 1000, 500, and 250 meter spatial resolution. By the end of 1994, Liam Gumley had joined the group at CIMSS after working on MODIS since 1991 at NASA/GSFC. Prototype versions of retrieval algorithms were first delivered to NASA in 1995, followed by continually improved versions every year from then on. An early obstacle was the requirement that all MODIS software be stand-alone, which ruled out the use of McIDAS for deliverable MODIS algorithms. However the MODIS group continued to use McIDAS along with Interactive Data Language (IDL) for prototyping and visualization with great success. By 1998 the MODIS group at CIMSS was confident of the quality of its MODIS algorithms, and was eagerly awaiting the launch of the first spacecraft. By this time, Chris Moeller had become closely involved with efforts to characterize the performance of the two MODIS (AM and PM) instruments, which by now were mostly complete. When MODIS work first began at CIMSS in the early Terra was launched at 1:57 p.m. nineties, group memEST on December 18, 1999 from bers included Paul Vandenberg Air Force Base, Menzel, Chris Moeller, California. Kathy Strabala, and Steve Ackerman. The CIMSS group proposed to develop algorithms for atmospheric temperature and moisture profile retrieval, cloud top pressure and temperature retrieval, and cloud phase discrimination. Around 1993, the CIMSS group was asked by the MODIS science team to develop the cloud mask for MODIS, a product required by many other investigators. By this time, CIMSS and CIMSS • 2001 Due to a series of delays the launch date for EOS AM, now also known as Terra, slipped into June and then December of 1999. However on December 18, 1999 the 4 sive testing before launch. Naturally, the global data provided surprises, but thresholds and source code were quickly adjusted in the first few months of MODIS operations to improve the quality of the products from the CIMSS algorithms. In addition, the sensor itself presented on-orbit performance challenges which the CIMSS group immediately began investigating, in close cooperation with the MODIS Characterization Support Team (MCST) at NASA/GSFC. The direct broadcast ground station at SSEC is located atop a 40 ft tower on the roof of the SSEC building. The radome shown here contains a 4.4 meter auto-tracking antenna which acquires data from Terra whenever the spacecraft is 5 degrees or higher above the horizon. CIMSS MODIS group breathed a collective sigh of relief when Terra was successfully launched into a sun-synchronous polar orbit at 730 km altitude. After a checkout period during January and February 2000, the MODIS earth view door opened on February 24 and MODIS began collecting data. On February 25 the CIMSS MODIS group was able to toast the successful activation of the instrument, while viewing imagery served remotely from NASA/GSFC in McIDAS. Then the fun really began. The CIMSS MODIS group became much more familiar with the geography of the planet as they consulted Goode’s World Atlas to figure out what part of the earth they were viewing in each 5-minute chunk of MODIS data (known as granules). With help from the SSEC Data Center, automated Terra orbit predictions were produced in McIDAS every day making it much easier to find scenes of interest. Dave Santek and Russ Dengel made sure that McIDAS was able to display MODIS data from day one, and McIDAS continues to be a vital asset for the CIMSS MODIS group. Soon after MODIS ‘doorsopen’, the CIMSS algorithms implemented in good old FORTRAN-77 began to run routinely at NASA/GSFC on global MODIS data. To the surprise of no-one (at least those of us at CIMSS), the algorithms proved reliable and robust thanks to inten- A 4-day composite of MODIS clear sky reflectance (0.66 micron) at the top of the atmosphere. Clear sky pixels are identified automatically by the MODIS cloud mask algorithm developed by CIMSS. CIMSS has also become closely involved with the effort to make EOS sensor data available via direct broadcast (DB) from the Terra and Aqua (formerly PM) spacecraft. Early in 1999 NASA Headquarters provided funding for SSEC to install an EOS DB receiving station, and thanks to a very capable SSEC/CIMSS team led by Bob Fox, the DB ground station hardware from SeaSpace Corp. was installed on August 5, 2000. The first pass 5 CIMSS • 2001 from Terra MODIS was acquired on August 18, 2000, and since then between 4 and 6 passes per day have been acquired. By the end of December 2000, calibrated MODIS data were produced automatically for every Terra overpass, and the latest 7 days of passes were made available via anonymous FTP as well as via ADDE server for McIDAS users. Rink also joined the MODIS group to lend his expertise to modifying the operational MODIS Level-1 processing software from NASA/GSFC for DB use. The first version of the DB processing software, known as the International MODIS/AIRS Processing Package (IMAPP), was released on May 12, 2000 under the GNU General Public License and was quickly adopted by EOS DB ground stations worldwide for processing MODIS data. Prototype work on MODIS retrieval algorithms is underway, and the first science product software component of IMAPP will be released early in 2001. A CIMSS proposal to develop software for processing EOS DB data was funded by NASA in April 2000, with PI Allen Huang and Co-I’s Jun Li and Liam Gumley. Tom In 2001, CIMSS will continue to be closely involved in the MODIS program. The Aqua spacecraft is scheduled to be launched in the summer of 2001, and the suite of sensors includes a copy of MODIS as well as the AIRS/AMSU/HSB sounder. DB data from Aqua will be captured and processed at SSEC/CIMSS and will provide the first glimpses of the new science which will be possible by combining the high spatial resolution of MODIS with the high spectral resolution and sounding capability of AIRS/AMSU/HSB. In addition, CIMSS expects to play a key role in the bridge mission from EOS to NPOESS known as the NPOESS Preparatory Project (NPP) which will spin up in 2001. All told, 2000 has been an exciting and challenging year for the MODIS group at CIMSS which looks forward to producing new and scientifically significant results from this new generation of earth observing satellites. A large smoke plume streams eastward from a wildfire in Virginia’s Shenandoah National Park. This true-color MODIS image of the fire was obtained on November 1, 2000 via direct broadcast at SSEC and processed at CIMSS. CIMSS • 2001 6 SAFARI-2000 Chris Moeller round out the data set. Much of the subSaharan continent is burned annually in August and September to support agriculture; naturally induced fires at the end of the extensive African winter dry season also contribute to the burning. The aerosols from these fires circulate around a large persistent atmospheric gyre situated over southern Africa and create layers of atmospheric haze which occasionally spill out into the Atlantic and Indian Oceans. Characterizing the optical properties of these aerosols is of interest because they reflect incoming sunlight away from the earth, modifying the radiation balance between the earth and its atmosphere. A significant emphasis of SAFARI-2000 was to transfer understanding from the ER-2 based instrumentation to satellite based EOS instrumentation such as MODIS. With satellite based instruments we will be able to make global observations, improving monitoring of the global radiation balance. I n August and September 2000, University of Wisconsin CIMSS scientists participated in the SAFARI-2000 field experiment, a cooperative international effort hosted by South Africa. Using a NASA ER-2 aircraft based in Pietersburg, South Africa, CIMSS scientists collected radiometric measurements from the MODIS Airborne Simulator and the Scanning Highresolution Interferometer Sounder to study the evolution of atmospheric aerosols resulting from biomass burning in subSaharan Africa. The data collection also included a University of Washington CV580 and two South African Aero Commander aircraft to collect in situ samples of the atmospheric aerosols, as well as a host of ground based measurements to Though the activities and science of the field campaign commanded attention, CIMSS participants also found the culture and natural environment of South Africa engaging. Game parks containing freeroaming large animals were visited by many (have you ever been warded off by a 9’ tall bull elephant?). Locals also provided interesting insight into historical and present South African society. SAFARI-2000 presented participants with not only the opportunity for exciting science research, but an unforgettable experience as well. MAS imagery of fires and smoke at Madikwe Game Reserve, South Africa. Smoke from these and many other fires near the end of the dry season resides in the sub-Sahara African atmosphere for weeks, causing a persistent haze as it spirals around the sub continent in a broad high pressure gyre. 7 CIMSS • 2001 Using Geostationary Satellites to Detect and Monitor Biomass Burning Elaine Prins, Joleen Feltz, Chris Schmidt For nearly 15 years scientists at CIMSS, in collaboration with the NOAA/NESDIS Office of Research and Applications Advanced Satellite Products Team, have been using multispectral GOES imagery to monitor fires and smoke transport in the Western Hemisphere. The Automated Biomass Burning Algorithm (ABBA) and the Merged Automated Cloud/Aerosol Detection Algorithm (MACADA) were developed at CIMSS to automatically detect and characterize subpixel fires and to catalogue the extent of clouds and smoke. I n recent years interest in detecting and monitoring biomass burning, as related to forest wildfires, tropical deforestation practices, agricultural applications, and grassland management, has intensified. The explosion of space technology has given us the opportunity to monitor burning from space, increasing our awareness of the extent of biomass burning. Yet, we know little about the effects of biomass burning. Studies have shown that intensive biomass burning associated with naturally occurring forest fires, deforestation practices and savanna management is a major source of trace gases and aerosols, but the implication of these emissions on climate change remains a mystery. However, before the scientific community can assess the impact of biomass burning, we must be able to monitor the extent of burning. Satellite remote sensing technology offers the most efficient and economical means to monitor fires on a global and regional scale. The GOES-8 ABBA has been used extensively in South America to document spatial, diurnal, seasonal, and interannual variability in fire activity from 1995 to 2000. In addition to providing valuable information on fire patterns in South America, these analyses have provided insight on the utility of geostationary satellites for fire and smoke monitoring. Studies have shown that most fires in South America exhibit flaming conditions which can be detected from satellite for only a few hours. These results suggest the importance of monitoring fires as they occur throughout the day with geostationary satellites and not only at peak burning times. Figure 1 presents composites showing the number of hot spot pixels detected at 1745 UTC each day with the GOES-8 ABBA during the 1995 and 1997 fire seasons (June-October). Most of the fire activity is anthropogenic (over 90%) in origin and is located along the arc of deforestation in Brazil, but there is also considerable burning in Bolivia, Paraguay, and Northern Argentina. Each year shows the same basic pattern of burning. This is to be expected since human activities do not change dramatically from year to year. The composites show distinct burning patterns along rivers and in areas with recent road construction Figure 1. GOES-8 ABBA composites of the spatial distribution of hot spot pixels detected at 1745 UTC during the 1995 and 1997 fire seasons (0.25° grid). The composites show distinct burning patterns along rivers and roads as observed at locations a, b, and c. CIMSS • 2001 8 (linear features) as observed at locations a, b, and c. Figure 2 is a plot of the difference in fire activity between 1995 and 1997. Regions shaded in orange-red-magenta represent areas where fire activity was greater in 1995; blue-green regions represent areas where the fire activity was greater in 1997. Fire activity was greater in 1995 in Rondonia (location c), Bolivia, Paraguay (location d), and along the eastern portion of the arc of deforestation (location g). In 1997 there was increased activity north of Manaus (location b), in northeastern Brazil (locations a and f) and along the southern portion of the arc of deforestation (location e). Much of this increase was due to drought conditions associated with El Nino. Although these composites provide a tool for interannual comparison, results must be interpreted along with estimates of percentage cloud cover. GOES-8 MACADA derived cloud cover statistics for 1995 and 1997 show only minimal differences (1-2%) in opaque cloud coverage throughout the study region (Prins, et al., 2000). poral GOES data for early detection of large rapidly growing fires in remote regions of Quebec (Moreau, Personal Communication, 1999). During the 2000 wildfire outbreaks in the Western United States, the Wildfire ABBA documented diurnal variations in fire activity. An example of the Wildfire ABBA product at 2315 UTC on August 22 is shown in Figure 3. This image product is an alpha-blended composite of clouds taken from the GOES imagery, an ecosystem base-map that was derived from Advanced Very High Resolution Radiometer (AVHRR) data made available by the USGS at http://edcdaac.usgs.gov/glcc/glcc.html, and fire locations which are highlighted in the composite imagery. The algorithm is A new version of the GOES-8 ABBA is being evaluated for wildfire monitoring throughout the Western Hemisphere. The Wildfire ABBA has been redesigned to enable wildfire monitoring in most ecosystems and has been streamlined to allow for rapid processing of diurnal multispectral GOES data. Half-hourly Java animations of the experimental Wildfire ABBA fire product composites are posted on the Internet in nearreal time for fire monitoring in Canada, the United States, Central America, and South America (http://cimss.ssec.wisc.edu/goes/ burn/wfabba.html). Figure 2. GOES-8 ABBA 1995 minus 1997 difference plot composite. Regions shaded in orange-red-magenta represent areas where the fire activity was greater in 1995; bluegreen regions represent areas where the fire activity was greater in 1997. Initial evaluation of the Wildfire ABBA indicates improvements in identifying wildfires and distinguishing between fires and highly reflective surfaces and cloud edges, and an order of magnitude reduction in false alarms. In Canada preliminary studies have demonstrated the utility of high-tem- expected to be transitioned into NOAA/NESDIS operations by the end of 2001. 9 CIMSS • 2001 Geostationary imagery and derived fire products in the Western Hemisphere provide a prototype for future global geostationary fire monitoring efforts. This will be possible with the launch of the European Meteosat Second Generation (MSG) satellite and the replacement Japanese Multi-functional Transport Satellite (MTSAT-1R) in the 2003 timeframe. In collaboration with researchers in Europe (EUMETSAT) and Asia, the GOES Wildfire ABBA will be adapted for application with the MSG and MTSAT-1R. This will enable global automated fire detection and monitoring using a common algorithm. Fire products will be made available to the environmental monitoring and climate change community for real-time fire monitoring, seasonal and interannual trend analysis, and for assimilation into numerical models (Prins, et al., 2000). References Moreau, M. (1999), Personal Communication. Environment Canada/Meteorological Services/Quebec region. Ste-Foy, Quebec, Canada. Prins E. M., and W. P. Menzel. (1992), Geostationary satellite detection of biomass burning in South America. Int. J. Remote Sens. 13:2,783-2,799. Prins, E. M., and W. P. Menzel. (1994), Trends in South American biomass burning detected with the GOES VAS from 1983-1991. J. Geophys. Res. 99( D8):16,719-16,735. Prins, E. M., J. M. Feltz, W. P. Menzel, and D. E. Ward. (1998), An overview of GOES-8 diurnal fire and smoke results for SCAR-B and the 1995 fire season in South America. Jour. of Geo. Res. 103(D24):31,821-31,836. Figure 3. The GOES-8 Wildfire ABBA composite fire image at 2315 UTC on August 22, 2000 shows the locations of wildfires in Washington, Idaho, and Montana. Real-time animations of the Wildfire ABBA product are available on the web at http://cimss.ssec.wisc.edu/goes/burn/ wfabba.html. CIMSS • 2001 Prins, E., J. Schmetz, L. Flynn, D. Hillger, J. Feltz, 2000: Overview of current and future diurnal active fire monitoring using a suite of international geostationary satellites, In Global and Regional Wildfire Monitoring: Current Status and Future Plans, edited by F. Ahern, SPB Academic Publishing, The Hague, Netherlands, In print. 10 CIMSS Researchers Lead Inter-Agency Study of Upper Level Water Vapor Dave Tobin T he ARM/FIRE Water Vapor EXperiment (AFWEX) is a recent field campaign that was conducted at the Atmospheric Radiation Measurement (ARM) site in northern Oklahoma with a primary objective of assessing the accuracy of ARM upper level water vapor measurements. The observations are being used in studies of upper level water vapor in relation to outgoing longwave radiation, to the formation of cirrus clouds, and to future satellite validation efforts. The experiment ran from November 27 to December 15, 2000 and included participation by the ARM, NASA First ISCCP (International Satellite Cloud Climatology Project) Regional field Experiment (FIRE), and National Polarorbiting Operational Environmental Satellite System programs. The experiment included ground-based observations from the ARM central facility site near Lamont, Oklahoma and aircraft-based observations from the NASA DC-8 and the high altitude Scaled Composites Proteus aircraft. An on-going effort within the ARM program has been to improve the accuracy of clear and cloudy sky atmospheric radiation parameterizations. For clear sky studies, an accurate determination of atmospheric water vapor concentrations is required. Previous ground-based ARM water vapor experiments (Water Vapor Intensive Operation Periods, WVIOPs) have focused on the accuracy of lower tropospheric water vapor measurements and its relation to the downwelling radiation detected at the surface (e.g., as observed by AERI). The third WVIOP was held in September and October 2000 with a goal of determining the absolute radiometric accuracy of the ARM microwave radiometer (MWR). Current analyses suggest that the accuracy of MWR integrated water vapor measurements and resulting model calculations of downwelling infrared flux are approaching levels required for energy balance and climate studies. Due to strong radiative absorption and emission by water vapor in the farinfrared spectral region, water vapor in the upper troposphere plays a dominant role in determining upper level atmospheric cooling rates, dynamical feedbacks, and the outgoing longwave radiation of the Earth’s atmosphere. Upper level water vapor concentrations are also important for radiation studies due to their role in the formation of Sample ARM Raman Lidar vertical cross sections of linear depolarization ratio (top panel) and water vapor mixing ratio (bottom panel) during AFWEX. Above ~4 km during daytime periods (~1400 to ~0000 UTC), water vapor mixing ratios from Vaisala radiosondes are shown. cirrus clouds. To address these issues, as well as to prepare for on-going and future satellite validation efforts using ARM water vapor measurements, AFWEX was conceived. The ARM approach to observing upper level water vapor uses a combination of instruments including the ARM Raman Lidar, the MWR, and tower-based in-situ sensors. With the benefit of an altitude independent calibration factor, the Raman 11 CIMSS • 2001 Lidar water vapor profiles are calibrated using either an integrated column amount determined from the MWR, or using a single point from the tower-based sensor. During nighttime conditions, ~30 minute integrations are adequate to provide acceptable noise performance up to 12 km. The basic goal of AFWEX is to assess the accuracy of these ARM Raman Lidar profiles in comparison to other active and in-situ observations. Biases in the ARM radiosondes can then also be studied. Secondary science objectives included: The NASA DC-8 operations were based out of Tinker Air Force Base and its payload included: • a zenith and nadir viewing DIAL system, • an in-situ cryogenic dew/frost-point hygrometer, • an in-situ tunable diode laser water vapor absorption system, • an infrared spectrometer (the ScanningHIS), and • in-situ sensors of CH4, CO, CO2, O3, and temperature. • collection of collocated Scanning-HIS and NAST-I spectra for calibration studies, • observation of thick cirrus and its signature in the far-infrared and millimeter wave spectral regions, • collection of NAST data across frontal boundaries for sounding studies, • ground-based observations of surface radiative temperature and emissivity for future satellite retrieval and validation efforts, and • compilation of clear sky validation case studies for forward model and retrieval studies. The basic observation strategy during AFWEX then was to perform coordinated NASA DC-8/Proteus flights over the ARM site during clear sky conditions. In addition to the standard compliment of ARM ground-based water vapor measurements (microwave radiometer, Raman Lidar, GPS, tower and ground-based in-situ sensors, AERI, etc.), ground-based instruments at the ARM site during AFWEX included: NASA DC-8 in flight A high speed aircraft-to-ground communications experiment allowing for network access during the DC-8 flights was also available (GOES and upper level wind images from UW and ARM data quicklooks were downloaded for real-time flight planning). The Proteus operations were based out of Stillwater airport and its payload included: • a high spectral resolution infrared sounder (the NAST-I), • a microwave spectrometer, and • an additional ground-based Raman Lidar system, • a millimeter-wave/far-infrared spectrometer. • 3-hourly Vaisala RS-80 radiosondes, • a ground-based Differential Absorption Lidar (DIAL) system, and • chilled mirror and VIZ radiosondes. CIMSS • 2001 Observations of surface radiative temperature and emissivity were made with the AERI-bago in the vicinity of the ARM site for several days during AFWEX. Coincident 12 satellite data from GOES, MODIS, and HIRS are also being compiled. along-wind level legs at altitudes of 25,000 to 41,000 ft. Proteus flight plans also included slow spiral ascents and descents, as well as figure-8 mapping patterns at 41,000 and 55,000 ft. With all flight hours completed and data collection objectives achieved, the Proteus made its return ferry flight to California on December 8, and the NASA DC-8 on December 11. Ground based operations continued through December 15. Scaled Composites Proteus aircraft at the Stillwater airport The quality and extent of the AFWEX dataset is exciting. It is perhaps the most extensive collection of upper level water vapor and collocated radiance measurements to date. Despite a slow start and several flight cancellations due to weather, many hours of collocated NASA DC-8, Proteus, and ARM site observations were obtained under clear sky and very-thin-cirrus conditions. A range of upper level temperature and water vapor concentrations were sampled. With only minor exceptions, all instruments operated well for the duration of the experiment. The flights were conducted at night to obtain higher altitude performance from the Raman Lidar systems. The DC-8 flights consisted of spiral ascents and descents centered on the ARM site (in order to create profiles from the insitu measurements) and cross-wind and Aerial view of the ARM central facility CART site A preliminary AFWEX dataset was compiled in February, analysis of the data has begun, and the investigators held a working meeting during the recent ARM Science Team Meeting in Atlanta in March. Another working meeting is planned for early September. For more information on AFWEX (science plan, daily summaries, quicklooks, data access information), go to http://arm1.ssec.wisc.edu/~data/exper/afwex/. 13 CIMSS • 2001 A recent CIMSS modeling study: The impact of five remotely sensed and five in-situ data types in the Eta Data Assimilation System Tom H. Zapotocny, W. Paul Menzel, James P. Nelson III and James A. Jung I n order to assess the impact of satellite data in synoptic scale weather forecasts, CIMSS began conducting data assimilation and numerical weather prediction (NWP) studies in the middle 1980s. In 1997, CIMSS acquired the complete Eta Data Assimilation/Forecast System (EDAS) from the National Centers for Environmental Prediction (NCEP). By updating the CIMSS EDAS to keep it current with the operational EDAS, CIMSS researchers can investigate the impact of satellite data sources in an operational NWP forecast system. Before undertaking long term impact studies, it was necessary to gain some knowledge about the sensitivity of the EDAS to the data it uses. Zapotocny et al. (2000) examined the sensitivity of all 34 data types used in the EDAS for a 6 February 1998 single case study. In that work, the EDAS was run repeatedly on the same case with varied sets of input data. A control run utilized all 34 data types throughout the 12-hr spin-up cycle and subsequent 48-hr forecast. Separate experiments were then run in which one of the data types was denied. Evaluating the difference between each denial experiment and the control run provided a measure of the sensitivity of the analysis and forecast system to each data type. The work reported in Zapotocny et al. 2001 follows up on this previous work. It describes the results of an experiment utilizing the EDAS to study the 24-hr forecast impact of five remotely sensed and five insitu data types during 11-day periods for three seasons (winter, spring and summer). The three 11-day periods are 13-23 December 1998, 10-20 April 1999, and 1323 July 1999. Sporadic data availability precluded the inclusion of an autumnal case for this work. CIMSS • 2001 The ten data types were selected as they represent ten of the largest contributors diagnosed in the Zapotocny et al. (2000) single case study results. The five satellite data types are Special Sensor Microwave/Imager vertically integrated precipitable water over maritime locations (SSM/I), GOES Sounder maritime three layer clear air precipitable water (GOESPW), TIROS Operational Vertical Sounder temperature profiles down to cloud top (TOVCD), GOES Imager maritime infrared cloud drift wind (GOESCD), and GOES Imager maritime water vapor cloud top wind (GOESWV). The five in-situ data types are rawinsonde temperature and moisture (RAOBM), rawinsonde wind (RAOBW), Aircraft Communications Addressing and Reporting System (ACARS) temperatures (ACARM), ACARS winds (ACARW), and land surface observations (SFCLM). The 24-hr forecast impact statistics at a given atmospheric level for a given meteorological field are obtained by averaging the root mean square differences between the denied forecast and the control forecast over all model forecasts. As computed, a positive forecast impact implies that the 24hr forecast was better with the data type included. The forecast impact is presented for three standard meteorological fields on five levels reaching vertically from near the earth’s surface (1000 hPa) to jet stream level (300 hPa). The three fields consist of temperature, the east-west component of the wind, and relative humidity. The northsouth component of the wind is not included since it is nearly identical to the eastwest component. In total, this experiment required 726 separate 48-hr EDAS model runs to build the control (simulation including all data types) and diagnostic (simulation with one data type denied) data sets. 14 A. 24-HR Domain Wide RMS Temperature Forecast Impact (Three season Summary) 0.18 0.12 K 0.06 0 -0.06 SSM/I GOESPW TOVCD GOESCD GOESWV RAOBM ACARM RAOBW ACARW SFCLM meters/second B. 24-HR Domain Wide RMS East-West Wind Forecast Impact (Three season Summary) 0.4 0.3 0.2 0.1 0 -0.1 SSM/I GOESPW TOVCD GOESCD GOESWV RAOBM ACARM RAOBW ACARW SFCLM Percent C. 24-HR Domain Wide RMS Relative Humidity Forecast Impact (Three season Summary) 1.5 1.2 0.9 0.6 0.3 0 -0.3 SSM/I GOESPW TOVCD GOESCD GOESWV RAOBM ACARM RAOBW ACARW SFCLM Data Type 300 hPa 500 hPa 700 hPa 850 hPa 1000 hPa Forecast impact summary of the ten data types after 24 hours of Eta model integration. The units of each field are listed on the y-axis. A positive value implies a more accurate forecast with the data type included. The time-averaged results of the experiment are summarized in the accompanying figure. The five remotely sensed data types are shown on the left half of each chart, while the five in-situ data types are shown on the right. Furthermore, within each data type, the five bars proceed from high in the atmosphere on the left to near the earth’s surface on the right. The figure demonstrates that at least a modest positive forecast impact is achieved from all data types when summed over three seasons. All the values are greater than zero for every data type except the 300 hPa east-west wind forecast impact from SSM/I. Rawinsonde temperature and moisture observations (RAOBM), rawinsonde winds (RAOBW) and GOES infrared cloud drift wind observations (GOESCD) have the largest impact when examining all three fields as a whole. However, both precipitable water data types (SSM/I and GOESPW) provide very significant positive forecast impact to the relative humidity field. Although not shown, the SSM/I and GOESPW forecast impacts are the largest during July and to a certain extent April. Both of these data types provide much smaller positive overall forecast impact during December. The RAOBM, RAOBW and GOESCD forecast impacts tend to be more constant from season to season. Cumulatively comparing the five left hand data types (remotely sensed information) with the five right hand data types (insitu information) indicates that during the three season average the remotely sensed data is of comparable importance to the insitu data. Of these ten data types, GOESWV and ACARM regularly provide the smallest overall forecast impact for each of the three fields; however, even their contributions are slightly positive when summed over the three 11-day periods. This study provides one of the first detailed assessments on the impact of remotely sensed versus in-situ data in an operational NWP model for an extended length of time. Future data impact studies using new data types could also prove to be very beneficial. Improvements in model forecast accuracy with the currently available data will only occur if a more complete understanding of how to utilize these data exists. References Zapotocny, T. H., S. J. Nieman, W. P. Menzel, J. P. Nelson III, J. A. Jung, E. Rogers, D. F. Parrish, G. J. DiMego, M. Baldwin, and T. J. Schmit, 2000: A case study of the sensitivity of the Eta data assimilation system. Wea. Forecasting, 15, 603-621. Zapotocny, T. H., W. P. Menzel, J. P. Nelson III and J. A. Jung, 2001: An impact study of five remotely sensed and five in-situ data types in the Eta data assimilation system. Conditionally accepted for publication in Wea. Forecasting. 15 CIMSS • 2001 The VISIT Program at CIMSS Scott Bachmeier and Tom Whittaker CIMSS has helped to revolutionize National Weather Service (NWS) training through collaboration in the Virtual Institute for Satellite Integration Training (VISIT) program. No longer must a course instructor or a NWS forecaster travel across the US to give or receive training. This new mode for training and collaborative science allows people to work and learn traditional course material (albeit in a new technologically advanced way) while in the comfort of their office. Oceanic and Atmospheric Administration cooperative institutes – CIMSS and the Cooperative Institute for Research in the Atmosphere in Ft. Collins, Colorado. The primary mission of VISIT is to accelerate the transfer of research results based on atmospheric remote sensing data into NWS operations. This transfer is accomplished through the education of NWS forecasters on the latest techniques to integrate remote sensing data, especially from satellite and radar. In the last year VISIT activities at CIMSS have been focused on two areas: • development of the Java-based VISITview application software, and • development of Instructional Components for “Using AWIPS in the Forecast Process.” Figure 1 The VISIT program is part of the NWS Integrated Sensor Training Professional Development Series. This series determines training requirements and coordinates the training development activities of the three NWS training centers and two National CIMSS • 2001 VISITview is a teletraining and realtime collaboration tool developed for the VISIT program to meet the needs of science training of NWS forecasters. Written in the cross-platform Java language, it emphasizes interactive functionality such as image animation, zooming, enhancement, and annotation, but also includes an integrated whiteboard/blackboard, a chat function, page-by-page quizzes, embedded audio, and connectivity to external HTML documents. During FY 2000, VISITview became widely adopted for use in NWS distance learning activities. A Graphical User Interface Lesson Builder was also developed to assist instructors creating VISITview lesson content. A VISITview mailing list is maintained for announcements and general discussions within the VISITview user community. During FY2000, two Instructional Components were developed at CIMSS and delivered as part of the IST PDS “Using AWIPS in the Forecast Process.” 16 “Diagnosing Elevated Mesoscale Ascent The Midland Texas Heavy Snow Event of 11 Dec 1998” was the first VISIT module to exclusively utilize integrated remote sensing and meteorological products from an Advanced Weather Information Processing System (AWIPS) case study. The focus of this lesson is the mesoscale banding evident on both radar and satellite, indicating organized regions of elevated ascent which led to a record snowfall at Midland, Texas. Screen capture of a sample lesson page is shown in Figure 1. The second module developed at CIMSS was “The Enhanced-V Cloud Top Signature: A Satellite Indicator of Severe Weather.” This lesson highlights the Minnesota tornado outbreak of 29 March 1998, and discusses the identification and interpretation of the Enhanced-V signature on GOES InfraRed data. In addition, examples of Enhanced-V signatures from other parts of the US and Canada are shown for comparison. Screen capture of a sample lesson page is shown in Figure 2. During FY2001, the “Elevated Mesoscale Ascent” and “Enhanced-V” lessons will continue to be available for teletraining courses. In addition, functionality of the VISITview software and Lesson Builder will be extended, based upon feed- Figure 2 back from the VISITview user community. Other Instructional Components will be completed and delivered, including “GOES Sounder Derived Products in AWIPS,” “Ingredients-Based Forecasting of Winter Precipitation,” and “Interpretation of GOES Water Vapor Imagery in AWIPS.” 17 CIMSS • 2001 The Summer Workshop in Atmospheric, Earth and Space Sciences Thomas Achtor L ast August, 25 high school students and teachers arrived on the UW-Madison campus on a Sunday afternoon to spend the better part of a week attending a workshop featuring topics in the atmospheric, earth and space sciences. This was the tenth year that CIMSS has sponsored the Summer Workshop, an interdisciplinary forum which features hands-on activities, computer technology, round-table discussions, laboratory demonstrations and field trips to promote participatory learning in the environmental sciences. study by looking at satellite, radar, and in situ data. They compared their hand drawn weather analyses from the morning to those they had created on McIDAS. The busy day ended with an evening road trip to the Milwaukee - Sullivan National Weather Service (NWS) Forecast Office. NWS fore- The Workshop began Sunday evening with an icebreaker and discussion of important issues in earth science. The group identified and discussed important topics for study during the ensuing week. Monday was a day of meteorology, beginning with an introduction to meteorological instruments and measurements, then moving on to data analysis and interpreting these results to gain understanding. casters showed the group their technological tools and explained how forecasts and warnings are made, The day long weather study was regarded as ‘fantastic’ by those known as ‘weather weenies’ (which includes CIMSS scientists and many participants). Students and teachers learned how to read, interpret and create weather maps using data from a case study of a recent Wisconsin significant weather event. In the afternoon, the map making and interpretation session used McIDAS (Man-computer Interactive Data Access System) with the students and teachers working on the case CIMSS • 2001 Tuesday morning the group worked on topics in Environmental Remote Sensing. Using computer workstations in groups of three or four, participants investigated how airborne and satellite-based sensors are used for natural resource management and environmental monitoring. Students and teachers were provided with an overview of how land cover mapping is achieved through the use of satellite sensors. Participants were then challenged to compare the accuracy of their newly acquired land surface classification skills during a hands-on computer exercise to classify vegetation coverage around Madison using Landsat imagery. On Tuesday afternoon, students and teachers participated with UW scientists in discussions and activities focused on Earth Science issues such as Climate Change, Biomass Burning, and Tropical Cyclones. Tuesday evening the 18 group gathered after dark to observe the skies from the campus Washburn Observatory. The group received an overview of the history of the telescope and an opportunity to view several celestial objects. Geology and Earth Science were the themes for Wednesday’s session, which began with a visit to the Geology Museum to view and discuss topics from dinosaurs to plate tectonics. Students and teachers then worked with scientists in laboratory sessions on volcanism, plate tectonics and ice age geology. On Wednesday afternoon, it was back to weather and forecasting. Students and teachers worked in teams with CIMSS meteorologists in a hands-on session which utilizes McIDAS to display satellite and radar imagery and create graphical weather analyses. Each group picked a region of the world that was having ‘interesting’ weather and created a presentation of their weather findings and a nowcast. After a bit of practice, the entire Workshop group visited each workstation to listen to the team presentations and learn about what’s going on in the weather all around the planet. The final day of the Summer Workshop program was a field trip to Devil’s Lake State Park, about 40 miles north of Madison, for a first-hand look at geological features that impacted south central Wisconsin. Led by an experienced former high school teacher, the group saw first hand the remaining features from the tropical islands that were battered by strong storms almost a billion years ago when the land now called Wisconsin lay near the equator. Three quarters of a billion years later, the ‘Ice Ages’ carved our landscape, altering the course of the Wisconsin River and creating Devil’s Lake. The field trip discussions helped to bring together conversations from the week about the hydrologic cycle, and the processes occurring on the land, ocean and atmosphere and how they are related. The day was full of exercise and scenic beauty, as well as a great hands-on learning experience in Wisconsin geology. A tired and happy group returned to Madison in the late afternoon where students reunited with parents, and CIMSS scientists reminisced on a unique week, very different from their normal research roles. We continue to place a strong emphasis on the inter-relationships and inter-disciplinary nature of the themes covered in this workshop. The scientific method which emphasizes “Observation, Analysis, Understanding and Prediction” guides our teaching strategies along with active, hands-on activities that emphasize the use of new technologies. The high ratio of staff to participants has been a key to the continuing success of this program from the perspective of the students and teachers as well as those of us who have enjoyed the opportunity to create and present this program for the past ten years. 19 CIMSS • 2001 Special Recognition Tim Schmit received a Department of Commerce Silver Medal for developing products with data from the latest generation of geostationary satellites (awarded September 2000). At the 2001 AMS Meeting Christopher Velden, Timothy Olander, and Steven Wanzong and CIRA colleague Raymond Zehr were awarded the prestigious AMS Banner Miller Award for two significant papers on hurricane forecasting techniques (published in Monthly Weather Review and Weather and Forecasting). Jun Li, Hal Woolf, Hong Zhang and Thomas Achtor received first prize at the International ATOVS Study Conference-XI (September 2000, Hungary) for their poster “Further Development of the International ATOVS Processing Package (IAPP).” Tom Whittaker and Scott Bachmeier were recognized for their work on VISITview as recipients of the Atmospheric Research and Applications Division Trainer of the Year Award for 2000. Elaine Prins was honored as NOAA Employee of the Month for May 2001. In nominating Elaine, her NOAA colleagues at CIMSS applauded her leadership role and quality work in the field of fire detection over the last two years. CIMSS is pleased to announce the winners of the fourth annual Verner E. Suomi Scholarship Award for Outstanding Achievement in the Physical Sciences: Michael Ahrens of Washburn High School (Washburn, WI), Kara Beck of Washington Park High School (Racine, WI), Maggie Brown of Southwestern High School (Hazel Green, WI), Paulina Bugembe of Milwaukee High School of the Arts (Milwaukee, WI), Joseph Fenrick of Campbellsport High School (Campbellsport, WI), and Alex Harrington of River Valley High School (Spring Green, WI). If you would like to be added to our mailing list to receive the CIMSS newsletter, please contact Leanne Avila (email: leanne.avila@ssec.wisc.edu). If you would like to learn more information about CIMSS, please visit our web site: http://cimss.ssec.wisc.edu/ CIMSS • 2001
