Christopher Ramos
Research Assistant
M.V. Lee Badgett
Research Director,
Professor of Economics,
University of Massachusetts-Amherst
Brad Sears
Executive Director
November 2008
Evidence of Employment Discrimination on the Basis of
Sexual Orientation and Gender Identity: Complaints Filed
with State Enforcement Agencies 1999-2007
EXECUTIVE SUMMARY
Today, twenty states and the District of
Columbia
prohibit
employment
discrimination
based
on
sexual
orientation. Of those, thirteen also
prohibit discrimination on the basis of
gender identity. In an effort to more
accurately measure the effect of antidiscrimination laws, this report compares
sex, race, and sexual orientation
complaint rates through a populationadjusted model.
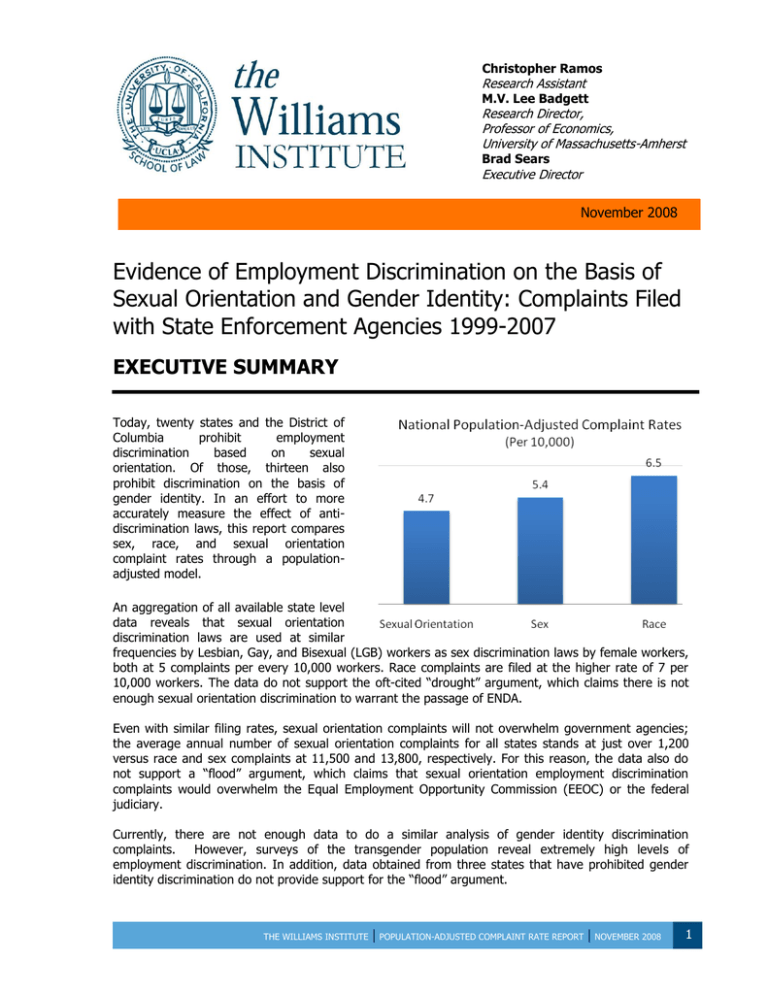
An aggregation of all available state level
data reveals that sexual orientation
discrimination laws are used at similar
frequencies by Lesbian, Gay, and Bisexual (LGB) workers as sex discrimination laws by female workers,
both at 5 complaints per every 10,000 workers. Race complaints are filed at the higher rate of 7 per
10,000 workers. The data do not support the oft-cited “drought” argument, which claims there is not
enough sexual orientation discrimination to warrant the passage of ENDA.
Even with similar filing rates, sexual orientation complaints will not overwhelm government agencies;
the average annual number of sexual orientation complaints for all states stands at just over 1,200
versus race and sex complaints at 11,500 and 13,800, respectively. For this reason, the data also do
not support a “flood” argument, which claims that sexual orientation employment discrimination
complaints would overwhelm the Equal Employment Opportunity Commission (EEOC) or the federal
judiciary.
Currently, there are not enough data to do a similar analysis of gender identity discrimination
complaints.
However, surveys of the transgender population reveal extremely high levels of
employment discrimination. In addition, data obtained from three states that have prohibited gender
identity discrimination do not provide support for the “flood” argument.
THE WILLIAMS INSTITUTE
| POPULATION-ADJUSTED COMPLAINT RATE REPORT | NOVEMBER 2008
1
INTRODUCTION
1
Today, twenty states and the District of Columbia prohibit employment discrimination based on sexual
orientation.1 Of those, thirteen also prohibit discrimination on the basis of gender identity. As a result,
an estimated 3.1 million lesbian, gay, bisexual, and transgender (LGBT) adults live in states that do not
provide this protection from discrimination in the workplace.2
For more than thirty years, Congress has considered expanding federal anti-discrimination laws to
prohibit sexual orientation discrimination. In 2007, Congress debated legislation that would have
prohibited both sexual orientation and gender identity discrimination. In November 2007, a version of
the Employment Non-Discrimination Act (ENDA) that prohibited sexual orientation but not gender
identity discrimination passed in the House of Representatives - a historic first in the thirty-year history
of such legislative efforts.
During the 2007 legislative debate, as in prior debates, opponents of ENDA advanced two arguments
based on the incidence of sexual orientation discrimination. Some contended that the bill would
inundate the Equal Employment Opportunity Commission (EEOC) and federal courts with trivial claims,
lowering the overall effectiveness of the EEOC and the judiciary (the “flood” argument). Others argued
that the law is simply unnecessary because there are few cases of sexual orientation discrimination
occurring in the workplace (the “drought” argument). 3
This report empirically assesses the validity of the “flood” and “drought” arguments by looking at the
experiences of states that have already passed laws prohibiting sexual orientation and/or gender
1
identity employment discrimination. The analysis proceeds in three steps. First, we place sexual
orientation employment discrimination complaints in relation to the total number of LGB people in the
workforce in order to get a more accurate measure of the complaint-filing rate of LGB people, or a
population-adjusted complaint rate. Second, we calculate population-adjusted complaint rates for sex
and race. Finally, we compare the complaint rate of LGB people to that of women alleging sex
discrimination and people of color alleging race discrimination. The population-adjusted method allows
for valid cross-category comparison. Due to the scarcity of available data, we are unable to do a similar
analysis for gender identity discrimination complaints.
METHODOLOGY
1
Replicating the methodology of William B. Rubenstein’s study completed in 2001, we contacted the
administrative agencies responsible for investigating employment discrimination complaints in all
twenty-one states that currently prohibit sexual orientation or gender identity discrimination in the
workplace.4 These agencies were contacted directly to acquire the most complete and updated data on
sexual orientation, gender identity, race, sex, and other forms of prohibited discrimination. 5 We
obtained data regarding sexual orientation discrimination complaints from seventeen states for two or
more years from 1999 to 2007. We excluded the four other states from our analysis because their laws
were passed too recently to provide at least two years of data on sexual orientation discrimination
complaints6 or because their administrative agency did not respond to our requests for data.7
For each state we then calculated an average annual number of complaints per protected group over
all the years in which data were available. The range of the average annual number of sexual
orientation discrimination complaints within these states is 1 (Vermont) to 605 (California). However,
these averages do not tell the entire story of sexual orientation discrimination; the difference in the
THE WILLIAMS INSTITUTE
| POPULATION-ADJUSTED COMPLAINT RATE REPORT | NOVEMBER 2008
2
2
4
average number of complaints between Vermont and California could simply be the result of the
difference in the size of the two states’ LGB populations.
Accordingly, our analysis uses a population-adjusted measure, which places the actual number of
complaints filed by any group in the context of that group’s workforce population. To calculate these
adjusted-rates we utilize two types of data: the number of complaints filed, delineated by basis of
discrimination, and the number of people most likely to file these types of claims in the state’s
workforce. For example, when examining sex discrimination complaints, we look at the number of sex
complaints filed and the number of women in the workforce. We use 2005 American Community Survey
(ACS) data to find the workforce population totals for women and people of color.8
We have also developed a method to compensate for the lack of reliable data on the number of LGB
people in the usual workforce datasets. First, we refer to the National Survey on Family Growth, which
found that 4.1% of men and women aged 18-45 identify as gay, lesbian or bisexual.9 Applying this
figure to the total adult population, we estimate that 8.8 million gay, lesbian, or bisexual adults live in
the United States. We then assume that, among all LGB people, the proportion who live in a given state
is equal to the proportion of same-sex couples who live in that state. Therefore, we multiply 8.8 million
by the percentage of same-sex couples living within each state to obtain estimates of LGB individuals in
a given state. For example, nearly 15% of same-sex couples live in California, the estimated size of the
LGB population in California is approximately 1.3 million (15% of 8.8 million GLB people in the U.S.).
Finally, we multiple the LGB population figure by the percent of the population older than sixteen in the
workforce of each state to find the number of LGB individuals in the state’s workforce; for California,
1.3 million is multiplied by 62% (the percent of population over 16) which yields 827,549 LGB people in
the workforce. Given that there is no universally accepted method to calculate the number of LGB
people in the workforce, this protocol establishes a reasonable estimate.
We then divide the average annual complaints for each group (LGB, women, and people of color) by
that group’s workforce population and multiply that figure by 10,000 to generate a population-adjusted
complaint rate. The adjusted rate represents the number of discrimination complaints per 10,000
workers in each protected class.
2
FINDINGS
When the size of the LGB workforce is incorporated into the analysis of complaint rates, our measure
shows that per capita sexual orientation discrimination complaints are filed at similar rates as race or
sex discrimination complaints. This is the primary finding of the study; data from each state support
this claim:
On the national level, of those states with available data, the adjusted rate for both sex and
sexual orientation complaint filings is 5 per 10,000 workers; the adjusted rate for race
complaint filings is higher at 7 per 10,000.
The adjusted rate for sexual orientation discrimination is higher than the adjusted rate for sex
discrimination in eight of the seventeen states surveyed.
The adjusted rate for sexual orientation discrimination is higher than the adjusted rate for race
discrimination in three of the seventeen states surveyed.
3
3
THE WILLIAMS INSTITUTE
| POPULATION-ADJUSTED COMPLAINT RATE REPORT | NOVEMBER 2008
3
POPULATION-ADJUSTED COMPLAINT RATES
PROVIDE AN IMPORTANT CONTEXT IN WHICH
TO ANALYZE THE RAW COMPLAINT DATA
Population-adjusted complaint rates provide the
context in which we can effectively analyze
discrimination complaint rates based on race, sex,
and sexual orientation. The raw data alone suggests
that the number of sexual orientation discrimination
complaints is small compared to large numbers of
complaints based on race and sex. However, even the
most disparate adjusted rates significantly decrease
the differences suggested by the raw data.
We refer back to California to demonstrate how
interpreting data through a population-adjusted
model places the raw numbers in proper perspective.
On average from 1999-2007, 4,204 people of color
filed discrimination complaints based on race and
6,899 women filed claims based on sex annually. By
contrast, an average of 605 LGB people filed claims
based on sexual orientation each year.
These raw numbers suggest that sex claims are filed
roughly seven times more often than sexual
orientation claims and that race claims are filed
eleven times more often than sexual orientation
claims. But the number of people of color in
California’s workforce (7,653,464) is higher than the
number of women (7,195,990) and both populations
are greater than the LGB people in the workforce
(827,549). Once we adjust the data for the workforce
population of each group, we are able to make more
sound comparisons. Adjusted rates show that
annually on average, 10 women per 10,000 filed sex
claims, 7 LGB workers per 10,000 filed sexual
orientation claims, and 5 people of color per 10,000
filed race claims. Although a seemingly small number
of sexual orientation complaints, they are actually
filed by LGB workers at a frequency 30% higher than
race complaints are filed by people of color in
California.
SEXUAL ORIENTATION CLAIMS ARE FILED
MORE FREQUENTLY THAN SEX
DISCRIMINATION CLAIMS IN EIGHT OF
SEVENTEEN STATES
The graph compares the adjusted-rates of sexual orientation and sex discrimination complaints for each
of the seventeen states surveyed. On a national level, the adjusted-rates for sexual orientation and sex
complaints are quite similar. For eight states (District of Columbia, Illinois, Maryland, New Jersey, New
York, Rhode Island, Vermont, and Washington), sexual orientation claims surpass sex claims. The
disparity within the remaining states varies from almost zero to more than double.
3
THE WILLIAMS INSTITUTE
| POPULATION-ADJUSTED COMPLAINT RATE REPORT | NOVEMBER 2008
4
SEXUAL ORIENTATION CLAIMS ARE FILED AS
FREQUENTLY AS RACE CLAIMS IN SEVEN OF
SEVENTEEN STATES
Table 1 compares the adjusted-rates for sexual orientation
and race discrimination in each of the seventeen states
surveyed. In three states (California, District of Columbia,
and Hawaii), sexual orientation complaints are filed more
frequently than race complaints. In the other fourteen
states, people of color filed complaints based on race at a
higher frequency than LGB workers filed complaints based
on sexual orientation; the disparity between these rates
vary from minimal to substantial.
LIMITATIONS ON THE ANALYSIS OF GENDER
IDENTITY EMPLOYMENT DISCRIMINATION AND
COMPLAINT RATES
Table 1
RACE – SEXUAL ORIENTATION
(COMPLAINTS PER 10,000 WORKERS)
Sexual
Race
Orientation
National
4.7
6.5
California
7.3
5.5
District of
8.8
2.1
Columbia
Hawaii
3.2
1.6
Connecticut
6.4
31.3
Illinois
4.8
6.4
Maine
3.8
37.8
Maryland
1.8
3.2
Massachusetts
3.6
15.2
Minnesota
2.2
9.1
New Hampshire
2.2
7.4
New Jersey
1.0
1.7
New York
4.1
5.9
Oregon
4.0
11.7
Rhode Island
2.3
5.8
Vermont
0.6
1.8
Washington
2.0
3.3
Wisconsin
5.8
38.8
Various studies have found that transgender individuals
face a substantial amount of discrimination, possibly even
more so than lesbian, gay, and bisexual individuals. 10
However, inadequate data collection is the main barrier to
a larger discussion around transgender discrimination in
general and to their inclusion in this study in particular. 11
Of the 20 states and the District of Columbia, which
currently protect LGB individuals from workplace
discrimination, only 13 also include gender identity or gender expression. Of those 13 that do include
gender identity/expression, 10 passed the statute within the past 3 years. The recent addition of
gender identity protections created a significant data gathering hurdle as some state agencies have not
adequately tracked gender identity/expression claims or they include those claims with sexual
orientation totals (for example, Washington). As a result, we were only able to collect complaint data
for gender identity/expression from Rhode Island, Oregon, and the District of Columbia (see Appendix
4
for totals). We are further prevented from calculating population-adjusted complaint rates for the
transgender population due to the lack of reliable data surrounding its actual size. Without a sound
estimate of the transgender workforce it is impossible to create adjusted complaint rates. The omission
of an analysis of gender identity discrimination complaints in this report reiterates the need for further
research.
CONCLUSION
As the debate surrounding the necessity of LGBT protections reenters the national discourse, a
population-adjusted understanding of complaint rates is necessary. This report questions two of the
main arguments used to attack the Employment Non-Discrimination Act. First, there is no “drought.”
Sexual orientation non-discrimination laws are used on a regular basis - comparable to the frequencies
at which race and sex rights laws are utilized. Second, state agencies are not vulnerable to any
debilitating “flood” of additional complaints. Given the size of the LGB population, and the filing rates of
LGB people, any increase in complaint intake would be negligible on the national level. Sweeping
generalizations of “floods” and “droughts” are empirically unsound. The data suggest that sexual
orientation employment protections are necessary and manageable.
THE WILLIAMS INSTITUTE
| POPULATION-ADJUSTED COMPLAINT RATE REPORT | NOVEMBER 2008
5
ACKNOWLEDGEMENTS
We thank Gary J. Gates and Nan Hunter for their close review and editing of this report and Christian
Cooper for his initial data gathering efforts.
ABOUT THE AUTHORS
Christopher Ramos is a Research Assistant at the Williams Institute, UCLA School of Law, B.A.
Pomona College. He studies social inequality through a lens of race, class, gender, and sexual
orientation.
Brad Sears is Executive Director of the Williams Institute, UCLA School of Law, where he is also an
Adjunct Professor of Law and teaches sexual orientation and disability law courses. His current research
focuses on HIV discrimination by health care providers.
M.V. Lee Badgett is Research Director at the Williams Institute, UCLA School of Law, and Director of
the Center for Public Policy and Administration at the University of Massachusetts-Amherst, where she
is also on the faculty of the Department of Economics. She studies family policy and employment
discrimination related to sexual orientation.
For more information, contact:
The Williams Institute
UCLA School of Law
Box 951476
Los Angeles, CA 90095-1476
T (310)267-4382
F (310)825-7270
williamsinstitute@law.ucla.edu
www.law.ucla.edu/williamsinstitute
5
1
Currently California, Colorado, Connecticut, Hawaii, Illinois, Iowa, Maine, Maryland, Massachusetts, Minnesota, 8
Nevada, New Hampshire, New Jersey, New Mexico, New York, Oregon, Rhode Island, Vermont, Washington, and
Wisconsin. For this report we refer to the District of Columbia as a “state.”
2
Figure calculated using American Community Survey (ACS) and National Survey on Family Growth data under the
protocol established later in the Methodology section of this report.
3
Rubenstein, William B. 2001. “Do Gay Rights Laws Matter?: An Empirical Assessment.” Southern California Law
Review. Vol 75, 65-120.
4
5
Id.
For a more detailed explanation of the methodology and its various shortcomings, including
overcounting/undercounting and intersectionality, see id at 76.
6
Colorado, Iowa, and Oregon.
7
New Mexico.
8
We use 2005 ACS data in order to cite already substantiated calculations. See Gates, Gary J. 2006. “Same-sex
Couples and the Gay, Lesbian, and Bisexual Population: New Estimates from the American Community Survey.”The
Williams Institute, UCLA School of Law. The Williams Institute. Los Angeles.
9
National Survey of Family Growth 2002.
THE WILLIAMS INSTITUTE
| POPULATION-ADJUSTED COMPLAINT RATE REPORT | NOVEMBER 2008
6
6
For transgender employees in education see Irwin, Jude. 2002. “Discrimination Against Gay Men, Lesbians, and
Transgender People Working in Education.” Journal of Gay and Lesbian Social Services. 14 (2), 65–77. For a more
general discussion of discrimination towards transgender individuals see: Lombardi, E.,Wilchins, R., Priesing, D., &
Malouf, D. 2001. “Gender violence: Transgender experiences with violence and discrimination.” Journal of
Homosexuality, 42 (1), 89–101.
11
Colvin, A. Roddrick. 2007. “The Rise of Transgender-Inclusive Laws: How Well Are Municipalities Implementing
Supportive Nondiscrimination Public Employment Policies?” Review of Public Personnel Administration. 27, 336361.
10
APPENDIX
SEXUAL ORIENTATION, RACE, AND SEX DISCRIMINATION COMPLAINTS FILED WITH STATES
CALIFORNIA
(law effective 1992)
Sexual Orientation
Race + Color
Sex
FY
1999
4,697
7,719
FY
2000
253
4,493
7,564
FY
2001
539
4,425
7,344
FY
2002
609
4,596
7,381
FY
2003
695
4,911
7,627
FY
2004
614
3,849
6,291
FY
2005
694
3,828
6,289
FY
2006
716
3,531
6,111
FY
2007
722
3,503
5,767
FY
1999
37
1,061
694
FY
2000
35
938
635
FY
2001
44
1,037
598
FY
2002
47
1,059
630
FY
2003
56
1,138
668
FY
2004
57
1,219
681
FY
2005
55
1,262
625
FY
2006
49
1,053
601
FY
2007
60
1,020
557
FY
1999
FY
2000
FY
2001
FY
2002
FY
2003
FY
2004
24
FY
2005
FY
2006
12
6
48
42
FY
2007
Source: California Department of Fair Employment and Housing
Connecticut (1991)
Sexual Orientation
Race + Color
Sex
Source: Connecticut Commission on Human Rights and Opportunities
District of Columbia
(1997)
Sexual Orientation
Gender Identity
Race + Color
Sex
30
37
Source: District of Columbia Office of Human Rights
Hawaii (1991)
Sexual Orientation
Race + Color
Sex
FY
1999
6
74
142
FY
2000
10
74
151
FY
2001
FY
1999
FY
2000
FY
2001
Source: Hawaii Civil Rights Commission
Illinois (2006)
Sexual Orientation
Race + Color
Sex
1,091
553
1,091
989
Source: Illinois Department of Human Rights
Maine (2005)
Sexual Orientation
Race + Color
Sex
FY
1999
71
258
FY
2000
68
263
Source: Maine Human Rights Commission
9
64
131
1,141
954
FY
2001
73
316
THE WILLIAMS INSTITUTE
FY
2002
12
79
148
FY
2003
FY
2002
FY
2003
1,209
1,080
FY
2002
97
296
5
65
151
1,127
1,043
FY
2003
82
262
Avg.
605
4,204
6,899
Avg.
49
1,087
632
Avg.
18
6
39
40
FY
2004
11
77
126
FY
2005
10
61
111
FY
2006
7
70
101
FY
2007
FY
2004
FY
2005
FY
2006
1,095
1,233
1,093
1,248
1,008
1,208
FY
2007
109
1,056
1,098
FY
2004
FY
2005
64
258
60
201
FY
2006
13
64
236
FY
2007
33
88
207
Avg.
3
60
94
8
69
128
Avg.
109
1,107
1,045
Avg.
| POPULATION-ADJUSTED COMPLAINT RATE REPORT | NOVEMBER 2008
13
72
261
Maryland (2001)
FY
1999
FY
2000
Sexual Orientation
Race + Color
Sex
334
223
FY
2001
328
225
FY
2002
17
393
216
FY
2003
24
398
206
FY
2004
22
266
145
FY
2005
22
274
150
FY
2006
21
242
185
FY
2007
28
240
112
FY
2001
40
1,000
680
FY
2002
83
954
913
FY
2003
FY
2005
51
635
931
FY
2006
64
592
816
FY
2007
699
699
FY
2004
81
742
906
Source: Maryland Commission on Human Relations
Massachusetts
(1989)
Sexual Orientation
Race + Color
Sex
FY
1999
FY
2000
Source: Massachusetts Commission Against Discrimination
Minnesota (1993)
Sexual Orientation
Race + Color
Sex
New Hampshire
(1998)
Sexual Orientation
Race + Color
Sex
FY
2000
24
238
346
FY
2001
31
252
320
FY
2002
33
285
330
FY
2003
27
214
284
FY
2004
22
242
305
FY
2005
25
200
241
FY
2006
27
165
190
FY
2007
21
164
165
FY
1999
FY
2000
FY
2001
FY
2003
16
29
126
FY
2004
4
21
126
FY
2005
7
24
118
FY
2006
5
21
138
FY
2007
14
25
138
25
171
8
23
107
8
14
124
FY
2002
18
19
126
FY
1999
13
238
69
FY
2000
16
325
110
FY
2001
17
270
101
FY
2002
9
188
95
FY
2003
20
203
109
FY
2004
18
207
99
FY
2005
20
169
98
FY
2006
13
157
74
FY
2007
16
220
94
CY
1999
CY
2000
CY
2001
CY
2002
CY
2003
118
1,853
1,368
CY
2004
163
1,885
1,448
CY
2005
152
1,884
1,209
CY
2006
159
1,796
1,171
CY
2007
152
1,581
1,114
FY
2003
36
1
269
582
FY
2004
45
0
291
629
FY
2005
35
3
307
711
FY
2006
33
0
310
644
FY
2007
FY
2003
FY
2004
3
1
38
106
FY
2005
7
0
43
73
FY
2006
2
0
51
82
FY
2007
Source: New Hampshire Commission for Human Rights
New Jersey (1992)
Sexual Orientation
Race + Color
Sex
Source: New Jersey Division on Civil Rights
New York (2003)*
Sexual Orientation
Race + Color
Sex
1,828
1,475
1,859
1,471
1,874
1,403
FY
1999
21
FY
2000
30
FY
2001
15
FY
2002
38
327
616
319
666
333
605
282
672
Source: New York Division of Human Rights - *Data are for calendar years, not fiscal years.
Oregon (2007)
Sexual Orientation
Gender Identity
Race + Color
Sex
Source: Oregon Civil Rights Division
Rhode Island
(1995)
Sexual Orientation
Gender Identity
Race + Color
Sex
FY
1999
FY
2000
FY
2001
FY
2002
3
0
42
96
THE WILLIAMS INSTITUTE
22
309
193
Avg.
64
770
824
FY
1999
32
223
307
Source: Minnesota Department of Human Rights
Avg.
Avg.
27
221
276
Avg.
10
22
130
Avg.
13
238
69
Avg.
149
1,820
1,332
Avg.
32
1
305
641
Avg.
5
1
52
0
| POPULATION-ADJUSTED COMPLAINT RATE REPORT | NOVEMBER 2008
4
.4
45
71
Source: Rhode Island Commission for Human Rights
Vermont (1991)
Sexual Orientation
Race + Color
Sex
FY
1999
2
0
7
FY
2000
FY
1999
FY
2000
FY
2001
0
1
3
0
0
1
Source: Vermont Human Rights Commission
Washington (2006)
Sexual Orientation /
Gender Identity
Race + Color
Sex
Sexual Orientation
Race + Color
Sex
FY
1999
FY
2003
FY
2002
FY
2003
2
2
0
FY
2004
2
2
5
FY
2005
0
3
2
FY
2006
4
3
10
FY
2007
FY
2004
FY
2005
FY
2006
FY
2007
Avg.
34
5
34
37
62
Avg.
0
4
3
246
339
220
300
255
285
203
252
144
186
107
162
189
257
113
191
FY
2000
FY
2001
49
1,005
1,066
FY
2002
85
1,133
1,175
FY
2003
71
1,110
1,091
FY
2004
76
1,136
987
FY
2005
58
1,127
911
FY
2006
51
1,004
811
FY
2007
60
995
727
Source: Washington Human Rights Commission
Wisconsin (1982)
FY
2001
FY
2002
2
2
6
Source: Wisconsin Civil Rights Bureau
THE WILLIAMS INSTITUTE
1
2
4
Avg.
64
1,073
967
| POPULATION-ADJUSTED COMPLAINT RATE REPORT | NOVEMBER 2008

