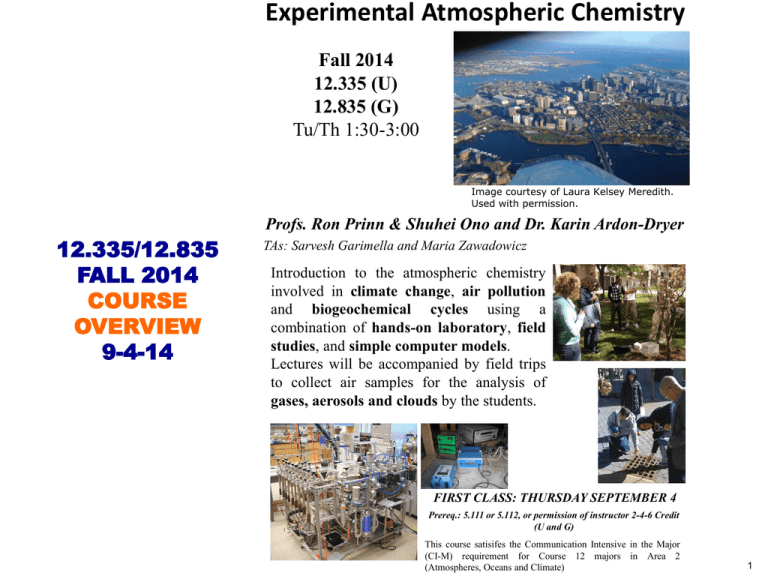
Experimental Atmospheric Chemistry
Fall 2014
12.335 (U)
12.835 (G)
Tu/Th 1:30-3:00
Image courtesy of Laura Kelsey Meredith.
Used with permission.
Profs. Ron Prinn & Shuhei Ono and Dr. Karin Ardon-Dryer
12.335/12.835
FALL 2014
COURSE
OVERVIEW
9-4-14
TAs: Sarvesh Garimella and Maria Zawadowicz
Introduction to the atmospheric chemistry
involved in climate change, air pollution
and biogeochemical cycles using a
combination of hands-on laboratory, field
studies, and simple computer models.
Lectures will be accompanied by field trips
to collect air samples for the analysis of
gases, aerosols and clouds by the students.
FIRST CLASS: THURSDAY SEPTEMBER 4
Prereq.: 5.111 or 5.112, or permission of instructor 2-4-6 Credit
(U and G)
This course satisifes the Communication Intensive in the Major
(CI-M) requirement for Course 12 majors in Area 2
(Atmospheres, Oceans and Climate)
1
2
12.335/12.835 Experimental Atmospheric Chemistry: Additional Grading Policies
Laboratory reports
Lab reports are due at the start of the class after the presentations are completed. This will allow you to
incorporate comments from the presentations into your lab report. We caution that you should start the
report well before the presentation day, if you wait until afterward as may not have sufficient time to
finish. Comments/grades on lab reports are returned approximately one week later. Students will revise
the first lab report based on the comments to earn back partial credit by the resubmission due date,
which is 1 week after the lab reports are returned. Late lab reports are penalized by making the
maximum possible grade be a declining fraction of full credit. Lab reports have a maximum of 75%
credit if turned in a day late and 50% credit when turned in two days late. Lab reports turned in more
than two days late will have a maximum grade of 25%. This policy is also in effect for the resubmitted
reports after the resubmission due date. The report MUST be resubmitted for CI-M credit.
Furthermore, if the first report is not resubmitted an additional 25% will be subtracted from the original
grade (e. g. an original grade of 90% will instead become 65%).
Presentations and Participation
Presentations will be submitted to the TAs via email before the start of the (first) presentation class.
This will allow the TAs to have presentation on the course computer for that class. Absence will only
be excused with a doctor’s note or other similar documentation (see below). In only this case students
will be given the opportunity to make up the presentation in a future class. Presentations represent
20% of the final grade.
Students will show up for all presentations regardless of if they are presenting. During each
presentation you will be expected to participate by asking questions of your peers. You will also return
a feedback report on the presentations the next day of class. Participation in class and presentations
represents 10% of the final grade.
Field Trips and Laboratory Work
Students must make all field trips and show up for all laboratory experiments. If the TA can manage, a
make-up field trip or laboratory appointment can be offered but this should not be expected.
Statement on Group Work
You will be working in groups during laboratory and field experiments and are free to collaborate on
the measurements and other group work that will form the basis of your individual presentations and
reports. However, all the slides in your presentations and all the text and graphs in your reports should
be your own work. Copying another person’s assignment text, data or figures will not be tolerated
and will result in a lower grade. All work should be fully referenced. For a general discussion of
academic integrity at MIT, please see http://web.mit.edu/academicintegrity/.
Special Circumstances
The penalties described above can be forgiven under special circumstances (for example, personal
reasons, health reasons, etc.) if the student provides documentation from Student Services, a doctor or
another reputable source.
3
Decreasing O3
decreases OH
Decreasing OH
increases CH4
Decreasing CO
increases OH
and decreases O3
Decreasing NOx
decreases O3
and OH
We will
measure
all these
air
pollutants
in the lab
and field
Section 1
Atmospheric
Chemistry &
Air Pollution
Summary of the chemistry in the troposphere important in air
pollution and climate. VOCs (not shown) are similar to CH4 in their
reactions with OH, but they form acids, aldehydes and ketones in
addition to CO.
4
Section 2
CO2 &
CLIMATE
CO2 & Climate Change
Part 1: Flux Chamber and
Portable CO2 Sensor
1-1) Flux chamber
experiments to
quantify CO2
source/sink flux
from
soil/grass/tree
1-2) Deploy portable
CO2 sensors to
examine local
CO2 hot spots.
Flux Chamber
© IPCC. All rights reserved. This content is excluded
from our Creative Commons license. For more information,
see http://ocw.mit.edu/help/faq-fair-use/.
Portable CO2 meter/data
logger
5
CO2 & Climate Change
Part 2: CO2 Cycle in Urban Environments
Air Intake
2-1) Examine the main controls of CO2 in
the urban environment from CO2
measurements from air taken from the
roof of the Green Building. e.g., diurnal
cycles (amplitude, phase), pollution
plume events.
2-2) Learn how to construct a simple box
model
MIT Green Building (~95 m)
© source unknown. All rights reserved. This content is excluded
from our Creative Commons license. For more information, see
http://ocw.mit.edu/help/faq-fair-use/.
CO2 mixing ratio data for July 4-9th
6
Explore different ways to measure CO2
FTIR (Thermo is5)
Aerodyne Research
Tunable Infrared Laser Direct Absorption Spectroscopy
© source unknown. All rights reserved. This content is excluded
from our Creative Commons license. For more information,
see http://ocw.mit.edu/help/faq-fair-use/.
Teledyne 360E
Gas Chromatography
Shimadzu GC-2014
© source unknown. All rights reserved. This content is
excluded from our Creative Commons license. For more
information, see http://ocw.mit.edu/help/faq-fair-use/.
K033 from CO2meter.com
© CO2 Meter. All rights reserved.
This content is excluded from our
Creative Commons license. For more
information, see http://ocw.mit.edu/
help/faq-fair-use/.
7
Section 3
Aerosols &
Clouds
Image courtesy of Pacific Northwest National Laboratory.
8
Average Rain Drop
Size: 2 mm
Average Cloud Droplet
Size: .02 mm
Average Condensation
Nucleus
Size: .0002 mm
Figure by MIT OpenCourseWare.
9
THIS IS A HANDS-ON COURSE
NOW LET’S GO SEE THE LABS!
10
MIT OpenCourseWare
http://ocw.mit.edu
12.335 / 12.835 Experimental Atmospheric Chemistry
Fall 2014
For information about citing these materials or our Terms of Use, visit: http://ocw.mit.edu/terms.


