November 17, 2005 Metamorphic isograds – Barrow
advertisement
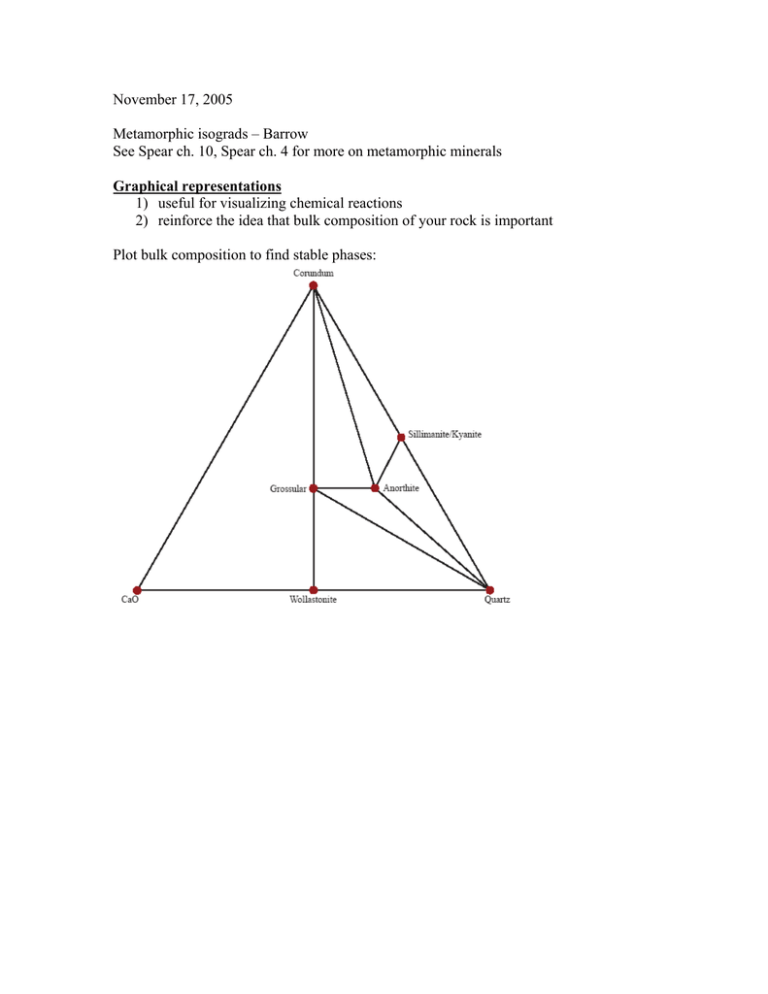
November 17, 2005 Metamorphic isograds – Barrow See Spear ch. 10, Spear ch. 4 for more on metamorphic minerals Graphical representations 1) useful for visualizing chemical reactions 2) reinforce the idea that bulk composition of your rock is important Plot bulk composition to find stable phases: Grossular + kyanite U anorthite + corundum Tie line switch – non-terminal reaction Anorthite U grossular + kyanite + quartz Terminal reaction – end of P-T stability of a phase Reactions in simpler, lower variance systems Kyanite U sillimanite c=1 Barrow’s metamorphic grades Pelites – J B Thompson (1957) developed an approach for understanding reactions in pelites. The system is: SiO2 – Al2O3 – K2O – MgO – FeO – H2O. He took advantage of some simplifying features in these rocks: 1) quartz assumed always present 2) H2O assumed present as fluid phase + H2O + SiO2 Can further simplify if muscovite is always present to the two-dimensional FMA diagram (F = FeO, M = MgO, A = Al2O3) Minerals Muscovite Sillimanite-Andalusite-Kyanite Quartz K-Feldspar Garnet Biotite Pyrope Almandine Phlogopite Annite Staurolite Chloritoid Chlorite Cordierite KAl2AlSi3O10(OH)2 Al2SiO5 SiO2 KAlSi3O8 Stable at low T + P and again at high T + P Mg3Al2Si3O12 Fe3Al2Si3O12 KMg3AlSi3O10(OH)2 KFe3AlSi3O10(OH)2 Fe2Al9Si4O22(OH)2 (Fe,Mg)2Al(OH)4Al3O2(SiO4)2 (Fe,Mg,Al)6(Si,Al)4O10(OH)8 Mg2Al4Si5O18 Low P indicator mineral To plot minerals in projection: 1) start with chemical analysis in wt % of oxides 2) divide each wt % by gm mol wt, renormalize Æ calculate mol % or mol fraction Project through muscovite onto FMA face, for example: Reactions when you have solid solution minerals: Continuous, 3 phase triangles move across the diagram Isograds – mineral appearances – depend on P, T, and the bulk composition
