MASSACHUSETTS INSTITUTE OF TECHNOLOGY Department of Civil and Environmental Engineering
advertisement
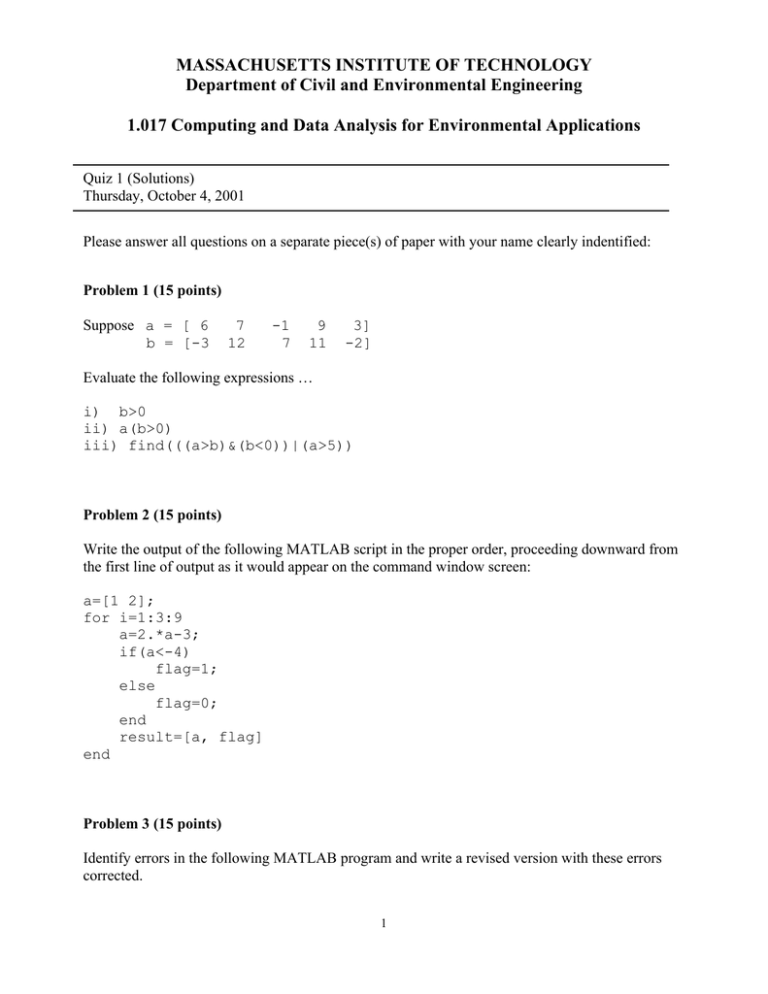
MASSACHUSETTS INSTITUTE OF TECHNOLOGY Department of Civil and Environmental Engineering 1.017 Computing and Data Analysis for Environmental Applications Quiz 1 (Solutions) Thursday, October 4, 2001 Please answer all questions on a separate piece(s) of paper with your name clearly indentified: Problem 1 (15 points) Suppose a = [ 6 b = [-3 7 12 -1 7 9 11 3] -2] Evaluate the following expressions … i) b>0 ii) a(b>0) iii) find(((a>b)&(b<0))|(a>5)) Problem 2 (15 points) Write the output of the following MATLAB script in the proper order, proceeding downward from the first line of output as it would appear on the command window screen: a=[1 2]; for i=1:3:9 a=2.*a-3; if(a<-4) flag=1; else flag=0; end result=[a, flag] end Problem 3 (15 points) Identify errors in the following MATLAB program and write a revised version with these errors corrected. 1 function main a= [0.2 0.5] b=3*ones(2,1) x=subfunc(a.*b) return function subfunc(a) x=sin(2*pi*a); return Problem 4 (25 points) Suppose that you are given a two dimensional array called land (with 10 rows and 10 columns) containing land use category identifiers defined as follows: 1 = forest 2 = urban 3 = agriculture 4 = other Row m and column n of the array land give the land use in the square cell located in position (m,n) of the grid shown below: m Shaded cell corresponds to row 5 (m=5), column 4 (n=4) n Suppose that each cell has the same area (2 ha). Write a MATLAB script that reads land from the file land.dat and prints out a four element vector containing the total areas associated with each of the four land use categories listed above (i.e. total forest area, total urban area, total agricultural area , total other area ). HINT: use the MATLAB sum function described in the attached handout. You will receive a 10 point bonus if your script has 4 lines or less. Problem 5 (30 points) Suppose that you are starting a small business with fixed expenditures of $10,000/month. You begin today with $20,000 in the bank drawing 0.4% /month interest. Write a MATLAB program (script or function) that plots your total assets at the end of each month vs. time for the next 24 months. Assume that your income for these 24 months is provided in a data file income.dat containing 24 numbers. 2

