9.16 Problem Set #4
advertisement
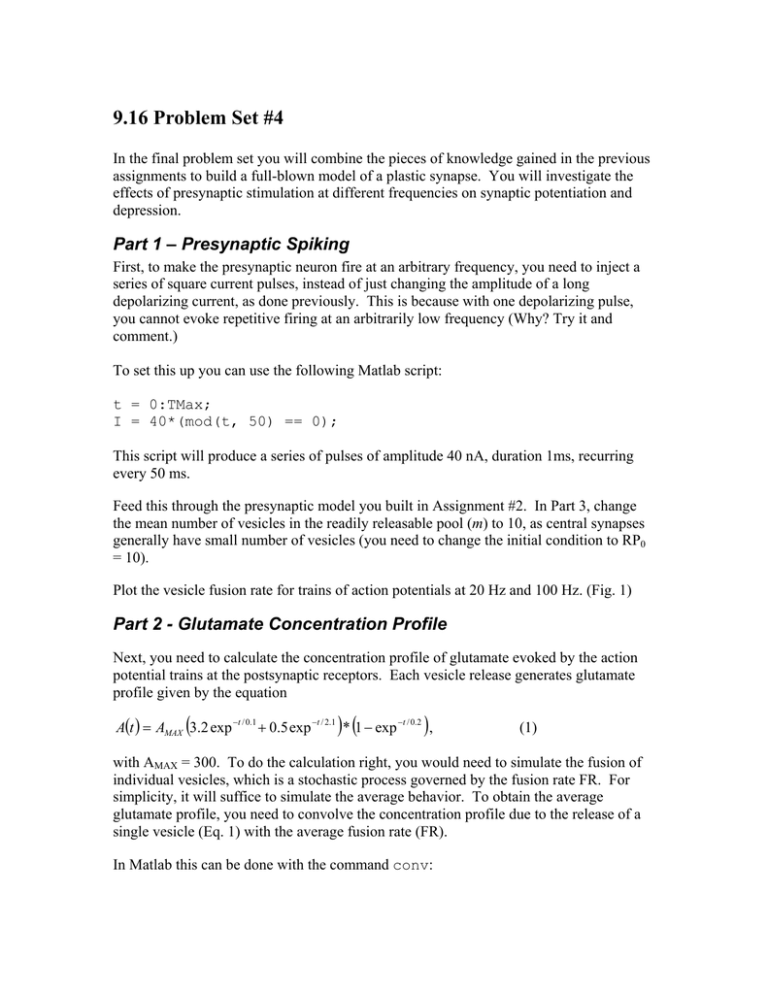
9.16 Problem Set #4 In the final problem set you will combine the pieces of knowledge gained in the previous assignments to build a full-blown model of a plastic synapse. You will investigate the effects of presynaptic stimulation at different frequencies on synaptic potentiation and depression. Part 1 – Presynaptic Spiking First, to make the presynaptic neuron fire at an arbitrary frequency, you need to inject a series of square current pulses, instead of just changing the amplitude of a long depolarizing current, as done previously. This is because with one depolarizing pulse, you cannot evoke repetitive firing at an arbitrarily low frequency (Why? Try it and comment.) To set this up you can use the following Matlab script: t = 0:TMax; I = 40*(mod(t, 50) == 0); This script will produce a series of pulses of amplitude 40 nA, duration 1ms, recurring every 50 ms. Feed this through the presynaptic model you built in Assignment #2. In Part 3, change the mean number of vesicles in the readily releasable pool (m) to 10, as central synapses generally have small number of vesicles (you need to change the initial condition to RP0 = 10). Plot the vesicle fusion rate for trains of action potentials at 20 Hz and 100 Hz. (Fig. 1) Part 2 - Glutamate Concentration Profile Next, you need to calculate the concentration profile of glutamate evoked by the action potential trains at the postsynaptic receptors. Each vesicle release generates glutamate profile given by the equation A(t ) = AMAX (3.2 exp −t / 0.1 + 0.5 exp −t / 2.1 )* (1 − exp −t / 0.2 ), (1) with AMAX = 300. To do the calculation right, you would need to simulate the fusion of individual vesicles, which is a stochastic process governed by the fusion rate FR. For simplicity, it will suffice to simulate the average behavior. To obtain the average glutamate profile, you need to convolve the concentration profile due to the release of a single vesicle (Eq. 1) with the average fusion rate (FR). In Matlab this can be done with the command conv: Glut = conv(FR, A); TGlut = 0:dt:(length(FR)+length(A)-2)*dt; plot(Tglut, Glut); % time vector (you have to make sure that FR and A are sampled at the same resolution, to ensure this, keep dt constant in all simulations. To see how to control sampling, look at the solutions to the previous assignments posted on the web). Plot the concentration of glutamate for the trains of action potentials at 20 Hz and 100 Hz. (Fig. 2) Part 3 – Receptor Activation Feed the glutamate concentration calculated in the previous section into the model for AMPA and NMDA receptors given in Assignment #3. (Fig. 3) Part 4 – Postsynaptic Activation Now use the HH equations to simulate the postsynaptic membrane potential. To do this rigorously, you would have to simulate the effects of both AMPA and NMDA currents on the membrane potential, while at the same time calculating the effects of the membrane potential on the NMDA current by modulating the Mg++ block, and the effects on both type of currents through the change in the driving force. To avoid this complication, you can assume that the NMDA current does not significantly contribute to the membrane potential (this is true for most time, since except during an action potential, NMDA receptor is largely blocked), and a constant driving force for AMPA receptors. That way, you can use the HH equations in the form from Assignment #1 without modification. To calculate the AMPA current, use the following equation: * I AMPA = E AMPA * g AMPA * N AMPA * A2 R AMPA where EAMPA is the driving force, gAMPA is the single channel conductance and NAMPA is the number of AMPA receptors. For simplicity, take gAmpa * EAmpa = 1, NAMPA = 50. (Fig. 4) Part 5 –Internal calcium Now you are in the position to calculate the Ca2+ flux through the NMDA receptors, and the resulting change in the postsynaptic [Ca2+] concentration. To model the Ca2+ current through the NMDA receptor, you can use the equation: * I Ca = − A2 R NMDA * (V - E Ca ) * g Mg g Mg e (V +30) / 10 = (V +30) / 10 e +1 ECa = 60 mV, where gMg is the voltage-dependent conductance modulated by the Mg2+ block, and V is the membrane potential calculated in Part 4. Plot ICa. (Fig. 5) Explain the qualitative differences between ICa and NMDA activation. Why is Ca flux correlated better with AMPA activation rather than NMDA activation? Why are there two spikes on the ICa trace for each postsynaptic spike? To calculate the change in the postsynaptic [Ca], you can use a simple integrator model with a diffusion constant D (this captures both the diffusion through the cytoplasm, and the effects of buffers). The corresponding equation is d [Ca ] = I Ca − D * [Ca ] dt The solution can be computed directly (without simulating) by convolving the impulse response function e − Dt of the system with the input ICa. Plot [Ca]. (Fig. 6) Part 6 – Ca Mediated Plasticity Now, into the final stage. The simplest model of Ca2+ modulated synaptic plasticity is the one in which high concentration of Ca2+ triggers receptor insertion and potentiation, while low concentration of Ca2+ triggers receptor internalization and depression. This mechanism can be modeled by a differential equation − N AMPA ) N AMPA (N d 1 , N AMPA = ([Ca ] − [Ca ]θ ) * (1 − e −[Ca ] / [Ca ]θ ) * MAX * τ N MAX N MAX dt where NAMPA is the number of AMPA receptors in the synapse, and [Ca]θ is the critical [Ca] concentration above and below which the synapse gets potentiated or depressed respectively. Note that this equation guarantees that 0 [Ca] has no effect on NAMPA, and that NAMPA stays bounded between 0 and NMAX. Simulate NAMPA with the initial value 50, NMAX = 100, [Ca]θ = 50, τ = 10, and two different presynaptic action potential trains, one at 20 Hz, the other at 100 Hz. What happens to NAMPA in the two cases? Experiment with different frequencies of presynaptic potentials. At what frequency is the change in the synaptic strength minimal? (there is one obvious solution to this question, what is the other one?) Part 7 – Congratulation You have just completed a model of two coupled neurons and reproduced frequency dependent synaptic plasticity in silico. Fusion Rate (vesicles/ms) Fusion Rate (vesicles/ms) Vesicle Fusion 1 100 Hz 0.8 0.6 0.4 0.2 0 0 10 20 30 40 50 60 70 80 90 100 0.5 20 Hz 0.4 0.3 0.2 0.1 0 0 10 20 30 40 50 60 Time (ms) 70 80 90 100 Fig. 1 Glutamate Concentration Profile 1200 100 Hz 20 Hz 1000 800 600 400 200 0 0 20 40 60 Time (ms) Fig. 2 80 100 120 Receptor Activation at 100 Hz 0.6 AMPA NMDA 0.5 0.4 0.3 0.2 0.1 0 -0.1 0 10 20 30 40 50 60 Time (ms) 70 80 90 100 80 90 100 Fig. 3 Postsynaptic Membrane Potential 60 40 20 0 -20 -40 -60 -80 0 10 20 30 40 50 60 Time (ms) Fig. 4 70 Ca flux through the NMDA receptor 3 2.5 2 1.5 1 0.5 0 -0.5 0 10 20 30 40 50 60 Time (ms) 70 80 90 100 Fig. 5 Postsynaptic [Ca] 140 120 100 80 60 40 20 0 -20 0 20 40 60 Time(ms) Fig. 6 80 100 120
