MASSACHUSETTS INSTITUTE OF TECHNOLOGY
advertisement
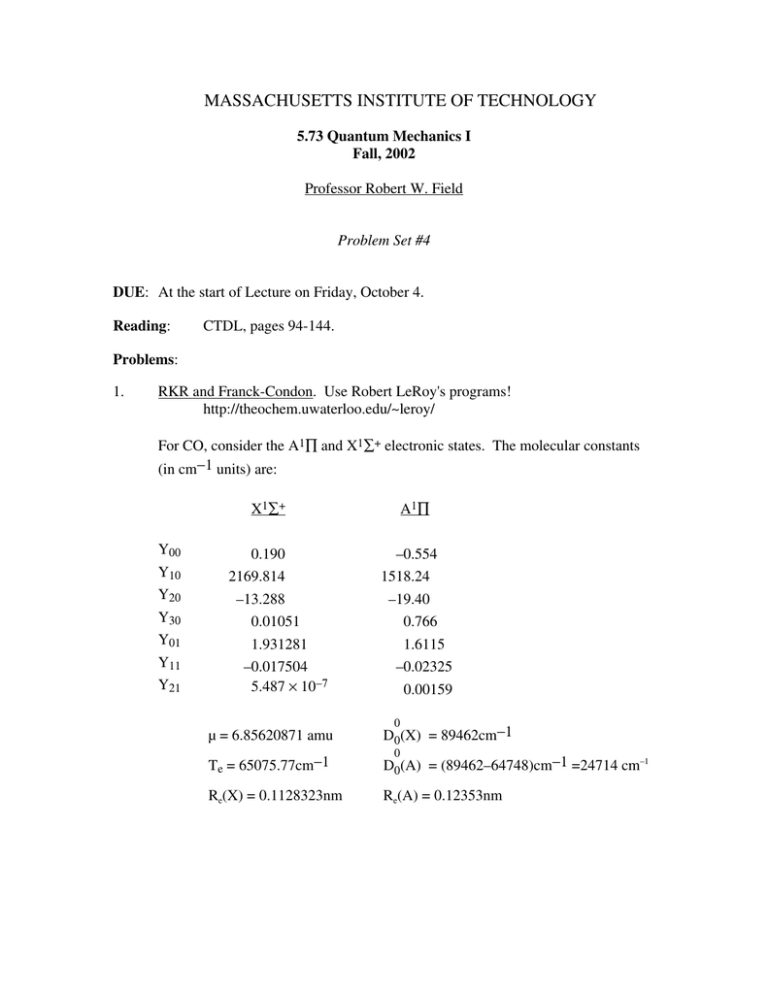
MASSACHUSETTS INSTITUTE OF TECHNOLOGY 5.73 Quantum Mechanics I Fall, 2002 Professor Robert W. Field Problem Set #4 DUE: At the start of Lecture on Friday, October 4. Reading: CTDL, pages 94-144. Problems: 1. RKR and Franck-Condon. Use Robert LeRoy's programs! http://theochem.uwaterloo.edu/~leroy/ For CO, consider the A1∏ and X1∑+ electronic states. The molecular constants (in cm−1 units) are: X1∑+ Y00 Y10 Y20 Y30 Y01 Y11 Y21 0.190 2169.814 –13.288 0.01051 1.931281 –0.017504 5.487 × 10⁻⁷ A1 ∏ –0.554 1518.24 –19.40 0.766 1.6115 –0.02325 0.00159 0 µ = 6.85620871 amu D0(X) = 89462cm−1 Te = 65075.77cm−1 D0(A) = (89462–64748)cm−1 =24714 cm–1 Re(X) = 0.1128323nm Re(A) = 0.12353nm 0 Chemistry 5.73 Problem Set #4 A. Page 2 Determine the RKR V(x) potential energy curves for the CO X1∑+ and A1∏ electronic states. Use the following G(v) and B(v) functions G( v) = Y00 + Y10 ( v + 1 /2) + Y20 ( v + 1 /2)2 + Y30 ( v + 1 /2)3 B( v) = Y01 + Y11 ( v + 1 /2) + Y21 ( v + 1 /2)2 as input to RKR. Ask RKR to calculate turning points for –1/2 ≤ v < 15 in steps of 0.25. B. Calculate overlap integrals, ⟨v′|v′′⟩, and Franck Condon factors for all transitions between v″ = 0 of the X-state to 0 ≤ v′ ≤ 15 of the A-state. The Franck-Condon factor is q v ′v ′′ = v ′ |v ′′ 2 where q is the F-C factor, v′ and v″ are respectively the vibrational quantum numbers for the upper (A) and lower (X) electronic states. C. Sketch what the A–X absorption spectrum would look like. Consider that initially only v″ = 0 is populated and represent each vibrational band as a vertical line, at the frequency of the v′ ← v″ = 0 transition, with height equal to the F-C factor. [This cartoon of the spectrum ignores the rotational structure of each vibrational band.] D. Now create a wavepacket in the A1∏ state by using a 1fs laser pulse, centered at ~72,000 cm–1, to in effect transfer the v″ = 0 wavefunction onto the upper potential. A 1fs pulse has a Fourier Transform width of ~ 15,000 cm–1. Ψ( x , 0 ) = ∑ v ′= 0,15 v′ v′′ = 0 ψ v ′ ( x ) [ x = R − Re ] (i) Plot |Ψ(x,0)|2 vs. x. Compare it to ψ v ′′= 0 ( x ) 2 . (ii) Calculate E = E0 , x = x0 , and p = p0 at t = 0 for this wavepacket. You are going to have to ask LeRoy's programs to calculate a lot (136 each for E, x, and p) of integrals of the form vi H v j , vi x v j , and vi p v j . If this turns out to be too difficult, use harmonic oscillator selection rules (∆v = ±1 for x and p, ∆v = 0 for H) and scaling rules ( v + 1 x v = ( v + 1)1/2 1 x 0 and similarly for p). Chemistry 5.73 Problem Set #4 E. Page 3 (iii) Why is p0 ≈ 0? Why is ⟨x⟩0 ≈ Re(X) – Re(A) = –0.0107nm? Why is E0 ≈ 65,076 + VA(R = Re(X))? (iv) The classical Franck-Condon principle requires that, because an electronic transition is “instantaneous”, the nuclear coordinates and momenta do not change, ∆R = 0 and ∆P = 0. The ∆R = 0 rule requires transitions to be vertical and the ∆P = 0 rule is nearly equivalent to a requirement that strong transitions be from turning point to turning point (where p(x±) = 0). This means that you can determine E0 and ⟨x⟩0 from a simple potential curve diagram rather than the lengthy calculation you have done in part D(ii). Compare the values of E0 and ⟨x⟩0 obtained from the potential curve diagram to those you obtained in a rigorous calculation. Now set up Ψ( x, t ) = ∑ v ′= 0,15 v′ v′′ = 0 ψ v ′ ( x )e − iEv′ t / h for the wavepacket in part D. You have already calculated ⟨v′|v″=0⟩ in part B. Be sure to retain the signs of the overlap integrals. (i) Compute and plot x t , p t . (ii) What does your plot of ⟨x⟩t tell you about the width of the upper potential, VA(x), at ⟨E⟩0? [NOTE that ⟨E⟩t = ⟨E⟩0 = E0!] What does it tell you about the shape of VA(x)? What does the maximum value of ⟨p⟩t tell you about the depth of VA(x) (i.e. the energy of the minimum of VA(x))? (iii) ⟨x⟩t and ⟨p⟩t are not observable directly in a simple time-domain experiment. However, the average oscillation period of ⟨x⟩t of the wavepacket is easily measurable. Compare the oscillation period, T, defined as ⟨x⟩0 = ⟨x⟩T, to ρ(E0)/c, where ρ(E0) is the density of states at E0 in units of 1/cm–1 and c is the speed of light in units of cm/sec. You can obtain ρ(E0) from obtained from Evib = E0 – Te = G(v(E0)). dG ( v ) and v(E0) is dv v = v(E 0 ) Chemistry 5.73 Problem Set #4 F. Page 4 Plot the survival probability of your wavepacket 2 P( t ) = Ψ ( x , t ) Ψ ( x , 0 ) . You should see a series of partial rephasings, each one smaller than the previous one. Why? Will the system ever rephase nearly perfectly to P(t) ≈ 1.0? If so, can you predict when this will occur? G. There is a lot of useful information in P(t). The initial rate of decay of P(t) is related to dV( x ) because the force on the wavepacket is –1 dx x = x 0 times the gradient of V(x). In order to relate the initial decay rate of P(t), via classical mechanics, to the gradient of the potential at x0, we need to define a semi-classical length of the wavepacket so that we can imagine the wavepacket moving away from perfect overlap with itself at t = 0 and use this to define a time-dependent overlap probability. Use the distance of the first internal node of ψ v(E 0 ) ( x ) from x0 as this wavepacket length. What is the value of P(t) when a classical mechanical particle has moved from x0 to the position of the first node of ψ v(E 0 ) ( x ) . You can approximate V(x) as linear at x0. This provides a universal relationship between dV and the decay rate of P(t). Using this relationship, the dx x 0 slope of an excited potential curve may be experimentally determined at Re(x) from the observed H. dP . dt t = 0 The ratio of P(t) values at the second and first partial recurrences of the wavepacket, P(T2)/P(T1), provides information about the ratio of the anharmonicity of the potential to the average vibrational frequency at E0. For a G(v) function truncated to G(v) = Y10(v + 1/2) + Y20(v + 1/2)2 ρ(v) = Y10 + 2Y20(v + 1/2). Thus, for a wavepacket with average excitation energy E0, P(T2)/P(T1) is going to be related to the ratio d 2G dv 2 v = v(E 0 ) 2 Y20 ≈ . dG Y10 + 2 Y20 ( v + 1 / 2) dv v = v(E 0 ) Chemistry 5.73 Problem Set #4 Page 5 Since you determine Y10 + 2Y20[v(E0) + 1/2] from the oscillation period of P(t) determined in part E(iii), you can determine the anharmonicity constant from P(T2)/P(T1). From the known values of Y10, Y20, and v(E0) and your empirical value for P(T2)/P(T1), obtain a value for the universal proportionality factor relating P(T2)/P(T1) to Y10 and Y20. I. 2. What would |Ψ(x,0)|2 look like if you had started the system initially in v″ = 1 instead of v″ = 0? Would this two-lobed initial preparation make P(t) have a more complicated appearance? Explain. Speculate about the evolution of |Ψ(x,t)|2 for such a preparation. [HINT: think in terms of two wavepackets, each with its own values of ⟨x⟩0, ⟨p⟩0, and ⟨E⟩0.] Can you guess what these initial values are and how the center position and momentum of these two wavepackets would sample VA(x)? CTDL, page 203, #1. This is a beautiful introduction to “density matrices”.
