Factsheet # 21 Quantifying Vertical and Horizontal Stand Structure Using Terrestrial LiDAR
advertisement

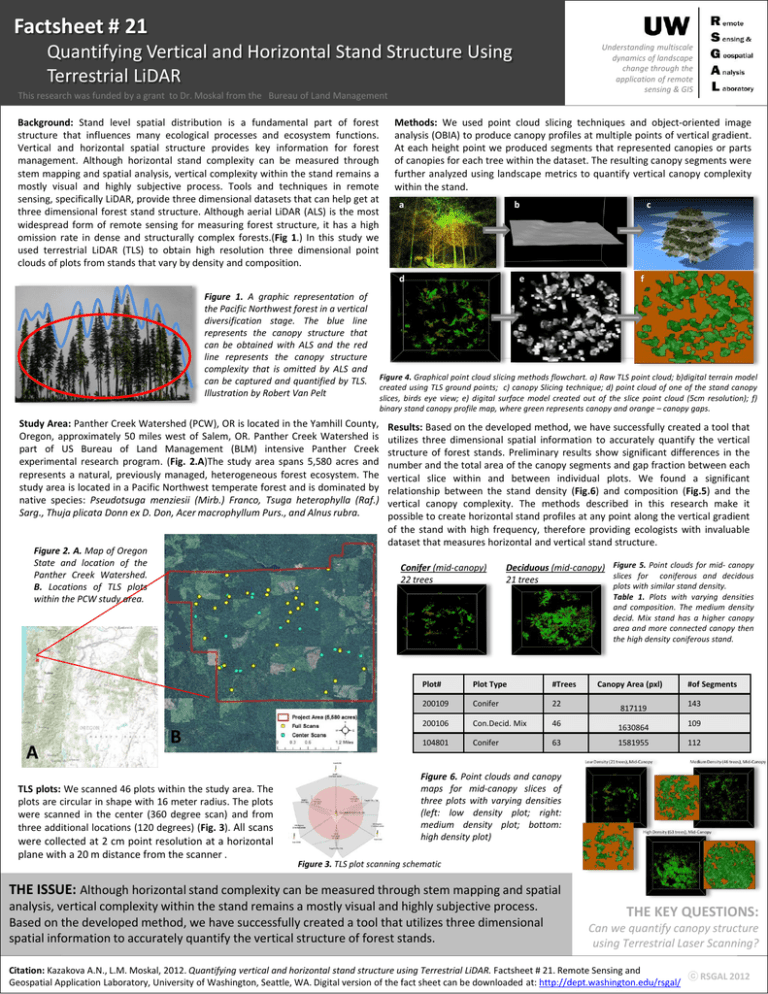
Factsheet # 21 Quantifying Vertical and Horizontal Stand Structure Using Terrestrial LiDAR Understanding multiscale dynamics of landscape change through the application of remote sensing & GIS This research was funded by a grant to Dr. Moskal from the Bureau of Land Management Background: Stand level spatial distribution is a fundamental part of forest structure that influences many ecological processes and ecosystem functions. Vertical and horizontal spatial structure provides key information for forest management. Although horizontal stand complexity can be measured through stem mapping and spatial analysis, vertical complexity within the stand remains a mostly visual and highly subjective process. Tools and techniques in remote sensing, specifically LiDAR, provide three dimensional datasets that can help get at three dimensional forest stand structure. Although aerial LiDAR (ALS) is the most widespread form of remote sensing for measuring forest structure, it has a high omission rate in dense and structurally complex forests.(Fig 1.) In this study we used terrestrial LiDAR (TLS) to obtain high resolution three dimensional point clouds of plots from stands that vary by density and composition. Methods: We used point cloud slicing techniques and object-oriented image analysis (OBIA) to produce canopy profiles at multiple points of vertical gradient. At each height point we produced segments that represented canopies or parts of canopies for each tree within the dataset. The resulting canopy segments were further analyzed using landscape metrics to quantify vertical canopy complexity within the stand. a b d Figure 1. A graphic representation of the Pacific Northwest forest in a vertical diversification stage. The blue line represents the canopy structure that can be obtained with ALS and the red line represents the canopy structure complexity that is omitted by ALS and can be captured and quantified by TLS. Illustration by Robert Van Pelt Study Area: Panther Creek Watershed (PCW), OR is located in the Yamhill County, Oregon, approximately 50 miles west of Salem, OR. Panther Creek Watershed is part of US Bureau of Land Management (BLM) intensive Panther Creek experimental research program. (Fig. 2.A)The study area spans 5,580 acres and represents a natural, previously managed, heterogeneous forest ecosystem. The study area is located in a Pacific Northwest temperate forest and is dominated by native species: Pseudotsuga menziesii (Mirb.) Franco, Tsuga heterophylla (Raf.) Sarg., Thuja plicata Donn ex D. Don, Acer macrophyllum Purs., and Alnus rubra. Figure 2. A. Map of Oregon State and location of the Panther Creek Watershed. B. Locations of TLS plots within the PCW study area. A e TLS plots: We scanned 46 plots within the study area. The plots are circular in shape with 16 meter radius. The plots were scanned in the center (360 degree scan) and from three additional locations (120 degrees) (Fig. 3). All scans were collected at 2 cm point resolution at a horizontal plane with a 20 m distance from the scanner . f Figure 4. Graphical point cloud slicing methods flowchart. a) Raw TLS point cloud; b)digital terrain model created using TLS ground points; c) canopy Slicing technique; d) point cloud of one of the stand canopy slices, birds eye view; e) digital surface model created out of the slice point cloud (5cm resolution); f) binary stand canopy profile map, where green represents canopy and orange – canopy gaps. Results: Based on the developed method, we have successfully created a tool that utilizes three dimensional spatial information to accurately quantify the vertical structure of forest stands. Preliminary results show significant differences in the number and the total area of the canopy segments and gap fraction between each vertical slice within and between individual plots. We found a significant relationship between the stand density (Fig.6) and composition (Fig.5) and the vertical canopy complexity. The methods described in this research make it possible to create horizontal stand profiles at any point along the vertical gradient of the stand with high frequency, therefore providing ecologists with invaluable dataset that measures horizontal and vertical stand structure. Conifer (mid-canopy) 22 trees B c Deciduous (mid-canopy) Figure 5. Point clouds for mid- canopy slices for coniferous and decidous 21 trees plots with similar stand density. Table 1. Plots with varying densities and composition. The medium density decid. Mix stand has a higher canopy area and more connected canopy then the high density coniferous stand. Plot# Plot Type #Trees 200109 Conifer 22 200106 Con.Decid. Mix 46 104801 Conifer 63 Canopy Area (pxl) 817119 1630864 1581955 #of Segments 143 109 112 Figure 6. Point clouds and canopy maps for mid-canopy slices of three plots with varying densities (left: low density plot; right: medium density plot; bottom: high density plot) Figure 3. TLS plot scanning schematic THE ISSUE: Although horizontal stand complexity can be measured through stem mapping and spatial analysis, vertical complexity within the stand remains a mostly visual and highly subjective process. Based on the developed method, we have successfully created a tool that utilizes three dimensional spatial information to accurately quantify the vertical structure of forest stands. THE KEY QUESTIONS: Can we quantify canopy structure using Terrestrial Laser Scanning? Citation: Kazakova A.N., L.M. Moskal, 2012. Quantifying vertical and horizontal stand structure using Terrestrial LiDAR. Factsheet # 21. Remote Sensing and ⓒ RSGAL 2012 Geospatial Application Laboratory, University of Washington, Seattle, WA. Digital version of the fact sheet can be downloaded at: http://dept.washington.edu/rsgal/


