Document 13436941
advertisement
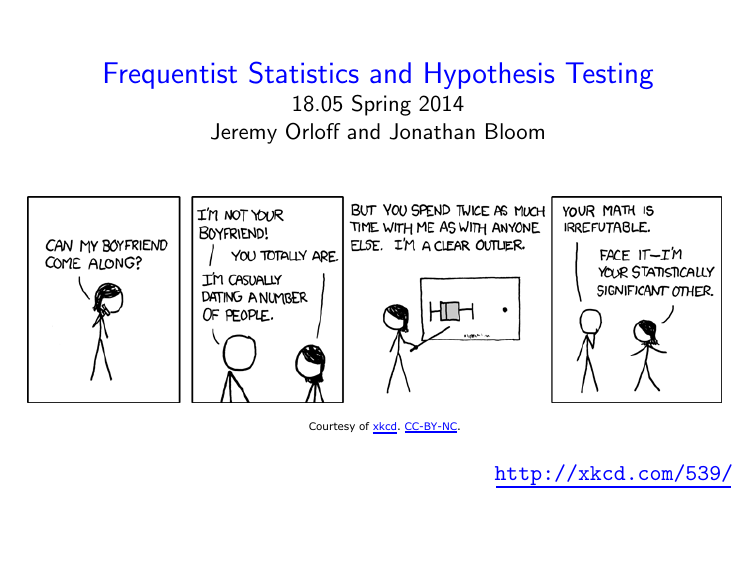
Frequentist Statistics and Hypothesis Testing 18.05 Spring 2014 Jeremy Orloff and Jonathan Bloom Courtesy of xkcd. CC-BY-NC. http://xkcd.com/539/ Agenda Introduction to the frequentist way of life. What is a statistic? NHST ingredients; rejection regions Simple and composite hypotheses z-tests, p-values June 1, 2014 2 / 19 Frequentist school of statistics Dominant school of statistics in the 20th century. p-values, t-tests, χ2 -tests, confidence intervals. Defines probability as long-term frequency in a repeatable random experiment. � � � Yes: probability a coin lands heads. Yes: probability a given treatment cures a certain disease. Yes: probability distribution for the error of a measurement. Rejects the use of probability to quantify incomplete knowledge, measure degree of belief in hypotheses. � � � No: prior probability for the probability an unknown coin lands heads. No: prior probability on the efficacy of a treatment for a disease. No: prior probability distribution for the unknown mean of a normal distribution. June 1, 2014 3 / 19 The fork in the road P (H|D) = Bayesian path Bayesians require a prior, so they develop one from the best information they have. P (D|H)P (H) Everyone uses Bayes’ formula when the prior P (D) is known. Frequentist path Frequentists reject the prior and draw inferences as best they can from just the likelihood function P (D|H). June 1, 2014 4 / 19 Disease screening redux: probability The test is positive. Are you sick? P (H) 0.001 H = sick P (D | H) 0.99 0.999 H = healthy 0.01 D = pos. test neg. test D = pos. test neg. test The prior is known so we can use Bayes Theorem. P(H = sick | D) = 0.001 · 0.99 ≈ 0.1 0.001 · 0.99 + 0.999 · 0.01 June 1, 2014 5 / 19 Disease screening redux: statistics The test is positive. Are you sick? ? P (H) H = sick P (D | H) 0.99 D = pos. test neg. test ? H = healthy 0.01 D = pos. test neg. test The prior is not known. Bayesian: use a subjective prior P(H) and Bayes Theorem. Frequentist: the likelihood is all we can use: P(D | H) June 1, 2014 6 / 19 Concept question Each day Jane arrives X hours late to class, with X ∼ uniform(0, θ). Jon models his initial belief about θ by a prior pdf f (θ). After Jane arrives x hours late to the next class, Jon computes the likelihood function f (x|θ) and the posterior pdf f (θ|x). Which of these probability computations would the frequentist consider valid? 1. none 5. prior and posterior 2. prior 6. prior and likelihood 3. likelihood 7. likelihood and posterior 4. posterior 8. prior, likelihood and posterior. June 1, 2014 7 / 19 Statistics are computed from data Working definition. A statistic is anything that can be computed from random data. A statistic cannot depend on the value of an unknown parameter. Examples of point statistics Data mean Data maximum (or minimum) Maximum likelihood estimate (MLE) A statistic is random since it is computed from random data. We can also get more complicated statistics like interval statistics. June 1, 2014 8 / 19 Concept questions Suppose x1 , . . . , xn is a sample from N(µ, σ 2 ), where µ and σ are unknown. Is each of the following a statistic? 1. Yes 2. No 1. The median of x1 , . . . , xn . June 1, 2014 9 / 19 Concept questions Suppose x1 , . . . , xn is a sample from N(µ, σ 2 ), where µ and σ are unknown. Is each of the following a statistic? 1. Yes 2. No 1. The median of x1 , . . . , xn . 2. The interval from the .25 quantile to the .75 quantile of N(µ, σ 2 ). June 1, 2014 9 / 19 Concept questions Suppose x1 , . . . , xn is a sample from N(µ, σ 2 ), where µ and σ are unknown. Is each of the following a statistic? 1. Yes 2. No 1. The median of x1 , . . . , xn . 2. The interval from the .25 quantile to the .75 quantile of N(µ, σ 2 ). 3. The standardized mean x̄−µ √ . σ/ n June 1, 2014 9 / 19 Concept questions Suppose x1 , . . . , xn is a sample from N(µ, σ 2 ), where µ and σ are unknown. Is each of the following a statistic? 1. Yes 2. No 1. The median of x1 , . . . , xn . 2. The interval from the .25 quantile to the .75 quantile of N(µ, σ 2 ). 3. The standardized mean x̄−µ √ . σ/ n 4. The set of sample values less than 1 unit from x̄. June 1, 2014 9 / 19 Cards and NHST Illustration of a royal flush removed due to copyright restrictions. June 1, 2014 10 / 19 NHST ingredients Null hypothesis: H0 Alternative hypothesis: HA Test statistic: x Rejection region: reject H0 in favor of HA if x is in this region f (x|H0 ) x2 reject H0 -3 0 accept H0 x1 x 3 reject H0 p(x|H0 ) or f (x|H0 ): null distribution June 1, 2014 11 / 19 Choosing rejection regions Coin with probability of heads θ. Test statistic x = the number of heads in 10 tosses. H0 : ‘the coin is fair’, i.e. θ = .5 HA : ‘the coin is biased, i.e. θ = .5 Two strategies: 1. Choose rejection region then compute significance level. 2. Choose significance level then determine rejection region. ***** Everything is computed assuming H0 ***** June 1, 2014 12 / 19 Board question Suppose we have the coin from the previous slide. 1. The rejection region is bordered in red, what’s the significance level? p(x | H0 ) .25 .15 .05 x 0 x 0 1 2 1 3 2 4 3 5 6 4 5 7 8 6 9 7 10 8 9 10 p(x|H0 ) .001 .010 .044 .117 .205 .246 .205 .117 .044 .010 .001 2. Given significance level α = .05 find a two-sided rejection region. June 1, 2014 13 / 19 Solution 1. α = .11 x 0 1 2 3 4 5 6 7 8 9 10 p(x|H0 ) .001 .010 .044 .117 .205 .246 .205 .117 .044 .010 .001 2. α = .05 x 0 1 2 3 4 5 6 7 8 9 10 p(x|H0 ) .001 .010 .044 .117 .205 .246 .205 .117 .044 .010 .001 June 1, 2014 14 / 19 Concept question The null and alternate pdfs are shown on the following plot f (x|HA ) reject H0 region f (x|H0 ) . x accept H0 region The significance level of the test is given by the area of which region? 1. red 2. purple 3. blue 5. blue + purple 6. red + purple 4. white 7. white + red + purple. June 1, 2014 15 / 19 z-tests, p-values Normal Data: x1 , . . . , xn ; unknown mean µ, known σ Hypotheses: Test statistic: Null distribution: z-value: p-values: Significance level: H0 : xi ∼ N(µ0 , σ 2 ) HA : Two-sided: µ 6= µ0 , or one-sided: µ > µ0 x̄ x̄ ∼ N(µ0 , σ 2 /n). x − µ0 √ σ/ n Two-sided p-value: p = P(|Z | > z | H0 ) standardized x̄: z= Right-sided p-value: p = P(Z > z | H0 ) For p ≤ α we reject H0 in favor of HA . June 1, 2014 16 / 19 Visualization Data follows a normal distribution N(µ, 152 ) where µ is unkown. H0 : µ = 100 HA : µ > 100 (one-sided) Collect 9 data points: x̄ = 112 Can we reject H0 at significance level .05? f (z|H0 ) ∼ N(0, 1) α = pink + red = .05 p = red = .008 accept H0 z.05 2.4 reject H0 June 1, 2014 17 / 19 Board question H0 : data follows a N(5, 102 ) HA : data follows a N(µ, 102 ) where µ 6= 5. Test statistic: x the average of the data. Data: 64 data points with x = 6.25. Significance level set to α = .05. (i) Find the rejection region; draw a picture. (ii) Find the z-value. (iii) Decide whether or not to reject H0 in favor of HA . (iv) Find the p-value for this data; add to your picture. June 1, 2014 18 / 19 Board question Two coins: probability of heads is .5 for C1 ; and .6 for C2 . We pick one at random, flip it 8 times and get 6 heads. 1. H0 = ’The coin is C1 ’ HA = ’The coin is C2 ’ Do you reject H0 at the significance level α = .05? 2. H0 = ’The coin is C2 ’ HA = ’The coin is C1 ’ Do you reject H0 at the significance level α = .05? 3. Do your answers to (1) and (2) seem paradoxical? Here are binomial(8,θ) tables for θ = .5 and .6. k p(k|θ = .5) p(k|θ = .6) 0 .004 .001 1 .031 .008 2 .109 .041 3 .219 .124 4 .273 .232 5 .219 .279 6 .109 .209 7 .031 .090 June 1, 2014 8 .004 .017 19 / 19 0,72SHQ&RXUVH:DUH KWWSRFZPLWHGX ,QWURGXFWLRQWR3UREDELOLW\DQG6WDWLVWLFV 6SULQJ )RULQIRUPDWLRQDERXWFLWLQJWKHVHPDWHULDOVRURXU7HUPVRI8VHYLVLWKWWSRFZPLWHGXWHUPV
