After 10 days u = (r S) / (4T t)
advertisement
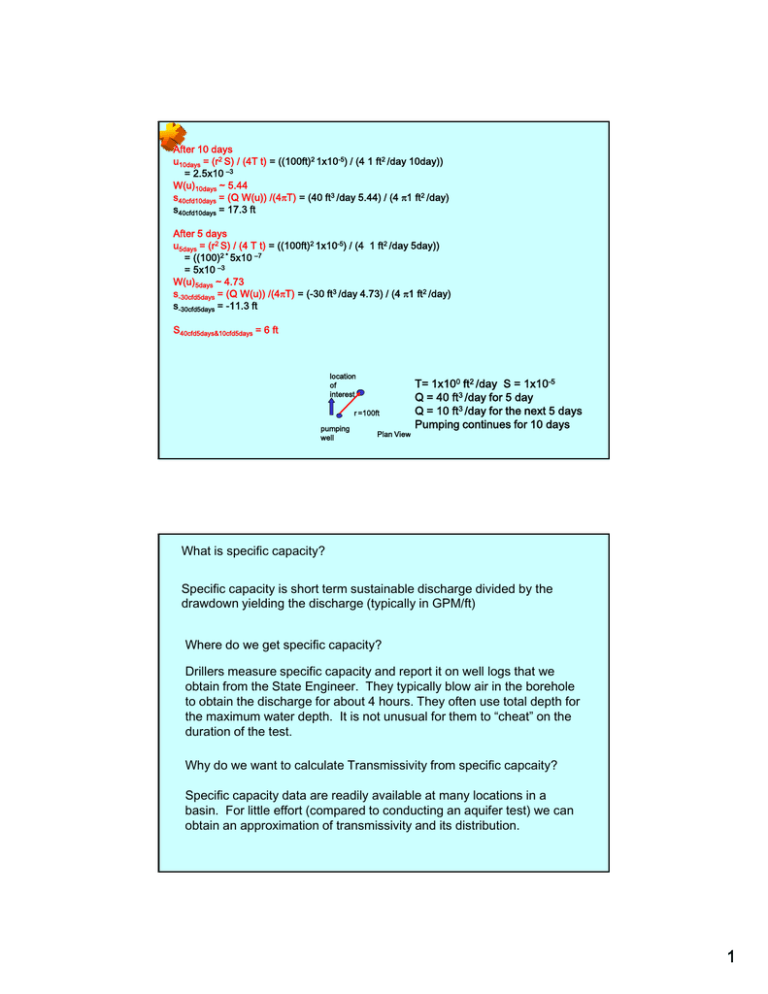
After 10 days u10days = (r2 S) / (4T t) = ((100ft)2 1x10⁻⁵) / (4 1 ft2 /day 10day)) = 2.5x10 –3 W(u)10days ~ 5.44 s40cfd10days = (Q W(u)) /(4πT) = (40 ft3 /day 5.44) / (4 π1 ft2 /day) s40cfd10days = 17.3 ft After 5 days u5days = (r2 S) / (4 T t) = ((100ft)2 1x10⁻⁵) / (4 1 ft2 /day 5day)) = ((100)2 * 5x10 –7 = 5x10 –3 W(u)5days ~ 4.73 s-30cfd5days = (Q W(u)) /(4πT) = (-30 ft3 /day 4.73) / (4 π1 ft2 /day) s-30cfd5days = -11.3 ft S40cfd5days&10cfd5days = 6 ft location of interest r =100ft pumping well Plan View T= 1x100 ft2 /day S = 1x10⁻⁵ Q = 40 ft3 /day for 5 day Q = 10 ft3 /day for the next 5 days Pumping continues for 10 days What is specific capacity? Specific What is specific capacitycapacity? is short term sustainable discharge divided by the drawdown yielding the discharge (typically in GPM/ft) Where do we get specific capacity? Drillers measure specific capacity and report it on well logs that we obtain from the State Engineer. They typically blow air in the borehole to obtain the discharge for about 4 hours. They often use total depth for the maximum water depth. It is not unusual for them to “cheat” on the duration of the test. Why do we want to calculate Transmissivity from specific capcaity? Specific capacity data are readily available at many locations in a basin. For little effort (compared to conducting an aquifer test) we can obtain an approximation of transmissivity and its distribution. 1 If KH= 4 KV= 1 b=200 ft How far must I be from the well to avoid affects of partial penetration? If KH= 4 KV= 1 b=200 ft r = 1.5 * (200ft) * 2 = 600 ft 1 3 2 4 Assuming this diagram is drawn to scale, what is the ratio of KH/KV? Discuss neighbors. g The ratiowith of Kyyour H/KV is approximately 1 because the lines of equal head are vertical starting about 1.5 aquifer thicknesses from the well bore. At which location will the error be greatest if you do not account for partial penetration? 1, 2, 3, or 4? How do you know? Discuss your neighbors. Locationwith 3, because it is closest to the x,y location of the well and furthest vertically from the well thus causing the greatest deviation from a fully penetrating situation. Using data from the sand tank on the next sheet Estimate K via Hvorslev AND Bouwer and Rice Methods How do the K values compare? And for the pump test we did earlier in the semester? How does the tank fit the assumptions of the methods? 2 c 2 Time since slug sec Bore radius = 4.9cm Screen Length = 6cm Saturated thickness = 30cm 2 4 6 8 10 12 14 16 18 h above initial water level cm 6.6 6 4.6 3.6 3 2.6 22 2.2 1.9 1.65 1.5 3
