HOW MUCH WATER DO WE NEED? volume per person per day
advertisement
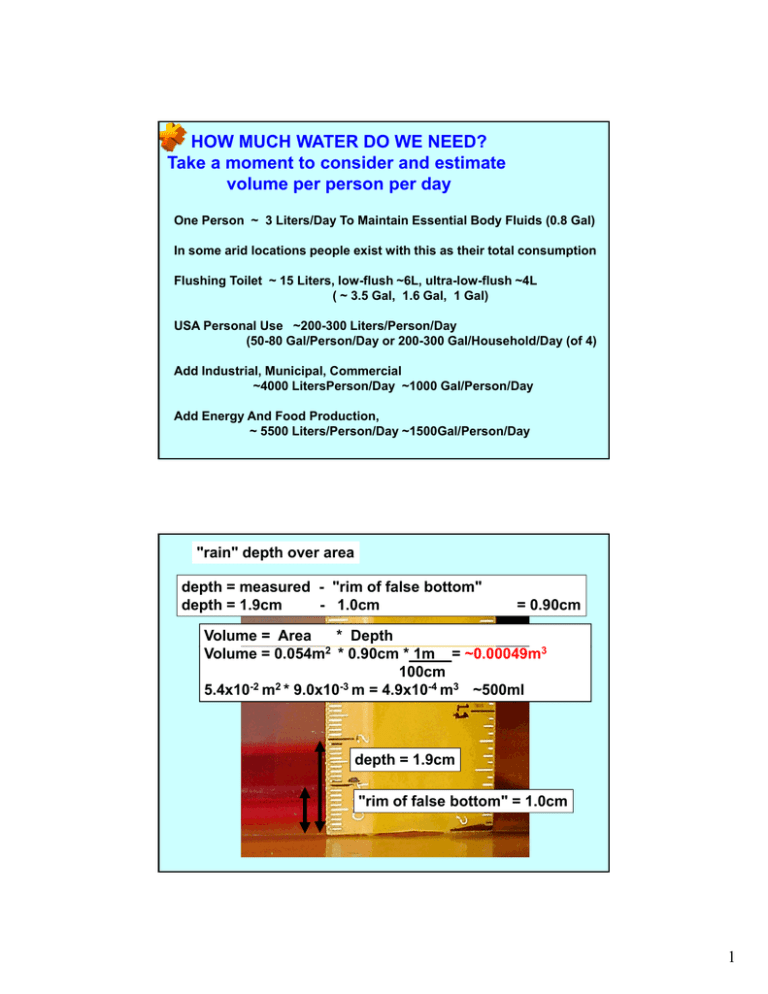
HOW MUCH WATER DO WE NEED? Take a moment to consider and estimate volume per person per day One Person Person?~ 3 Liters/Day To Maintain Essential Body Fluids (0.8 Gal) In some arid locations people exist with this as their total consumption Flushing Toilet Toilet?~ 15 Liters, low-flush ~6L, ultra-low-flush ~4L ( ~ 3.5 Gal, 1.6 Gal, 1 Gal) USA Personal Use? Use ~200-300 Liters/Person/Day ((50-80 Gal/Person/Day y or 200-300 Gal/Household/Day y ((of 4)) Add Industrial, Municipal, Commercial ? ~4000 LitersPerson/Day ~1000 Gal/Person/Day Add Energy And Food Production, Production? ~ 5500 Liters/Person/Day ~1500Gal/Person/Day "rain" depth over area depth = measured - "rim of false bottom" depth = 1.9cm - 1.0cm = 0.90cm Volume = Area * Depth 2 Volume = 0.054m * 0.90cm * 1m = ~0.00049m3 100cm -2 2 -3 5.4x10 m * 9.0x10 m = 4.9x10⁻⁴ m3 ~500ml depth = 1 1.9cm 9cm "rim of false bottom" = 1.0cm 1 to check for homogeneity: compute ratio of values at stations at same times compare - a break in constant ratio indicates a change if only 1 year it is an error otherwise, adjust early data to match later data either multiply or divide early values at the stationary station by the new ratio depending on whether the stationary station is in the denominator or the numerator of the ratio (see example) HOMOGENEITY CORRECTION EXAMPLE: YR A B A:B B:A Corrected 1 11 22 .50 2.00 5.06 ~5 2 10 21 .48 2.08 4.83 ~5 3 12 23 .52 1.92 5.29 ~5 4 6 23 .26 26 3 3.85 85 6 5 4 20 .20 5.00 4 6 5 21 .24 4.17 5 FOR A:B B x 0.23 = CORRECT A VALUE FOR 1,2,3 FOR B:A B / 4.3 = CORRECT A VALUE FOR 1,2,3 if data are missing, the most likely value is: where: n = number of stations near station x which has the missing value Px = missing value of precipitation @ station of interest “x” for given year Ax = average annual preciptation at station of interest “x” P# = precipitation at n nearby stations identified by # for given year A# = average annual precipitation at each of n stations identified by # TAKE 5 MINUTES homogeneity_missing.xls, sheets = “homogeneity” and “missing” http://inside.mines.edu/~epoeter/_GW/02Budget1/BudgetPrecipEvap.htm 25 in 2 Volume of Precipitation on Turkey Creek Basin in a year? Use 20 inches/yr for the average to facilitate moving along in class Area of Turkey Creek Basin? = 47.2 mi2 Take a few minutes to estimate the volume input to the Basin via precipitation (work together) Area[L2] * Rate[L/T] = Volumetric Rate [L3/T] First think of it in terms of an average flow rate 47.2 mi2 * 20 in * 1 ft * 5280ft * 5280ft ~ 2.19x109 ft3 yr 12in 1 mi 1 mi year so annual volume = 2.19x109 ft3 * 1 ac . year 43560ft2 * 1yr 1day ~ 70 ft3 365d 86400s sec ~ 50,000 AFY Recall 5000 AFY served ~22,000 homes Take 5 min to get the evaporation rate Mean Temp = 75 F Mean Dew Point Temp = 50 F Solar Radiation = 500 langley’s Wind Movement Mo ement = 200 mi/day 0.25 3 Suppose the budget was for the plastic pan for a 340sec time period? So it is hot hot hot and windy and in that brief time We find a large water level decline over the area Volume = Area * Decline 2 Volume = 0.054m * 0.0030m = ~0.00016m3 Water level decline = 1.8cm - 1.5cm = 0.30cm = 0.0030m Pre-outflow depth = 1.8cm Volume of Evapotranspiration in Turkey Creek Basin in a year? Hopefully when you researched the ET rate in TCB you would find the Jefferson County – Mountain Ground Water Resource Study Report http://inside.mines.edu/~epoeter/_GW/02Budget1/wri03-4034.pdf This is a big file & only FYI not required because: Use 18 inches/yr for the average to facilitate moving along in class Area of Turkey y Creek Basin? = 47.2 mi2 Take a few minutes to estimate the volume output to evapotranspiration Area[L2] * Rate[L/T] = Volumetric Rate [L3/T] First in terms of an average flow rate 47 2 mii2 * 18 in 47.2 i * 1 ft * 5280ft * 5280ft ~ 1 1.97x10 97 109 ft3 * 1yr 1 1d 1day ~ 63 ft3 yr 12in 1 mi 1 mi year 365d 86400s sec so annual = 1.97x109 ft3 * 1 ac . ~ 45,000 AFY volume year 43560ft2 Clearly it is the difference in precipitation and evapotranspiration That matters (20-18 inches) such that the net is 5000AFY 4
