L.I.D. Site Planning Concepts
advertisement
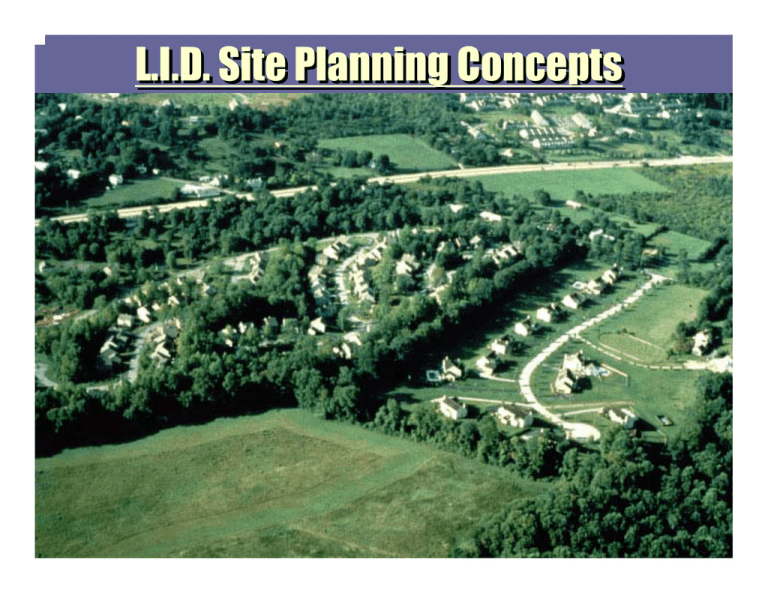
L.I.D. Site Planning Concepts What is L.I.D. ? • “The goal of L.I.D. is to develop techniques, strategies, BMPs, and criteria to store, infiltrate, transpire, retain, and detain runoff on the site to replicate the predevelopment runoff characteristics and mimic the natural and unique hydrology of the site.” • “With the L.I.D. approach, receiving waters experience little change in the volume, frequency, or quality of runoff or in base flows fed by ground water.” Key Considerations for LID Site Planning Examples of the LID site planning techniques include, but are not limited to: • Maintaining natural drainage ways and patterns. Disperse runoff, do not concentrate it. • Preserving as many trees as possible. Design with existing topography. • Reducing the percentage of impervious area • Locating BMPs in soils with the highest permeability • Disconnecting impervious areas. Discharge runoff from paved surfaces onto vegetated areas. • Limiting clearing and grading on individual lots Page 7 Key Considerations for LID Site Planning Examples of the LID site planning techniques include, but are not limited to: • Locate impervious areas on less permeable soils to minimize change in CN value. • Maintain existing natural topography and terrain, work with the topography, don’t re-engineer it. • Limit clear-cutting and mass grading of site. Save time and money on site work • Flatten slopes only within existing cleared and graded areas. Minimize major cuts and fills. • Revegetate areas that have been cleared and graded Page 8 Neo-Traditional Neo-Traditional Development Development Mass Clearing Mass Grading Small Lots Separate Garag Alleys 25% More Imper HIGH HIGH IMPACT IMPACT DEVELOPMENT DEVELOPMENT L.I.D. L.I.D.IS ISNOT NOT “CLEAR “CLEARCUTTING CUTTINGAND ANDMASS MASSGRADING” GRADING” Clear Cutting & Tree Save Mass Grading LID DEVELOPMENT LID Development CONVENTIONAL Conventional DEVELOPMENT Development WORK WORK WITH WITH THE THE LAND, LAND, MINIMZE MINIMZE DISTURBANCE DISTURBANCE Conventional Conventional Parking Parking Lot Lot L.I.D. L.I.D. Parking Parking Lot Lot B.M.P. “Big Muddy Pond” RETRO-FIT RETRO-FIT RAIN RAIN GARDEN GARDEN LINEAR LINEAR RAIN RAIN GARDEN GARDEN INFILTRATION TRENCHES Rain Gardens In Multi-Family Residential POROUS POROUS CONCRETE CONCRETE PEDESTRIAN PEDESTRIAN PLAZA PLAZA URBAN URBAN RAIN RAIN GARDEN GARDEN PARKING PARKING LOT LOT CANOPY CANOPY -- RAIN RAIN GARDEN GARDEN L.I.D. L.I.D. Design Design Example Example Performance Criteria 6 Basic Elements Need to be addressed: z z85% TSS removal z zUsing LID to treat the runoff from the first 1 inch of rainfall z zIn addition (if necessary) use LID alone or in combination with conventional practices to treat the difference in runoff from pre versus post conditions for the 2 year 24 hour storm in the Rural and Transitional Zoning Districts. Everywhere else use the 1 year 24 hour storm z zAny temporary water quality storage pools must drawdown in 48 to 120 hours. z zPeak storm water runoff rates shall be controlled for development above 12% impervious (1 dwelling/acre) z zNo one BMP shall receive runoff from an area greater than 5 acres. Steps Steps in in Preparation Preparation of of aa Conceptual Conceptual Plan: Plan: Site SiteAnalysis Analysis Preliminary PreliminarySketch Sketch S.E.T. S.E.T.Calculations Calculations Hydrologic HydrologicAnalysis Analysis Final FinalConceptual ConceptualPlan Plan Mecklenburg Mecklenburg County County Soils Soils Map Map Site Site B Soils C Soils D Soils Site Location Map Gilead Road Site Site SITE Site Analysis Site Site Analysis Analysis Topography Topography((2’2’Contours Contours)) Natural NaturalDrainage DrainagePatterns Patterns Ridges Ridgesand andValleys Valleys Vegetation Vegetation((Meadow, Meadow,Mature Maturetrees trees)) Soils Soils((HSG HSGA,A,B, B,C, C,DD)) Hydrology Hydrology((CN, CN,Tc Tc)) Groundwater GroundwaterDepth Depth Wetlands Wetlands Floodplains Floodplains S.W.I.M. S.W.I.M. Buffers Buffers Steep SteepSlopes Slopes((>>15% 15%)) Access Accessand andConnectivity Connectivity Utilities Utilities(Sanitary, (Sanitary,Water Wateretc.) etc.) Easements Easements((Duke DukePower, Power,Sanitary, Sanitary,etc. etc.)) Zoning Zoning(Setbacks, (Setbacks,Density, Density,Open OpenSpace Space)) Vegetation Vegetation&&Floodplain Floodplain Floodplain Floodplain Evergreens Evergreens Hardwoods Hardwoods SWIM SWIMBuffer Buffer Hardwoods Hardwoods Evergreens Evergreens 15% - 25% Slopes Site Analysis Map Slopes Drainage PaE Ridge > 25% Slopes MO Soils Floodplain CeD2 Floodplain Drainageway H.P. CeB2 Site Site Location Location Existing ExistingEntry EntryRoad Road Evergreens Evergreens Thick ThickGround GroundCover Cover Hardwoods Hardwoods Secondary Secondary Growth Growth Main MainDrainage DrainageChannel Channel Site Analysis Worksheet 15% - 25% Slopes Site Analysis Map PaE Slopes > 25% Slopes Drainage Soils MO Floodplain CeD2 Total Site Area: 61.194 Acres Floodway 4.472 Acres (0.0% Credit) Floodplain 1.722 Acres (0.50 Credit) Slope >25% 1.555 Acres (0.25 Credit ) 61.194 - 4.472 - 0.861 - 1.167 54.694 Drainageway H.P. CeB2 Gross Acres Floodway Floodplain ( 0.50 x 1.722) Steep Slope ( 0.25 x 1.555) Net Buildable Area Huntersville Transitional Zone Options: 1 0.80 Units / acre with 25% Open Space = 43 Lots on 45.90 Ac 2 2.00 Units / acre with 40% Open Space =109 Lots on 36.72 Acr Assume 20% for roads = 0.85 Acre Lots (37,000 SF) for Option 1 = 0.28 Acre Lots (12,000 SF) for Option 2 SELECT OPTION 2, 109 LOTS 40% OPEN SPACE Floodplain L.I.D. Best Management Practices BMPs for Use in Huntersville (Tables 6.1 and 6.2, Pages 48 and 49) BMP Applicable Zoning Districts(1) Applicable Performance Criteria (2) Design Function(3) Function(4) (WQ, VC, PC) Strategic Clearing & Grading U, T, R 3(a) WQ, VC, PC Reduce Impervious Surfaces U, T, R 3(a) WQ, VC, PC Bioretention (Rain Garden) U, T, R 3(a), 3(b) Section 4.0 WQ, VC, PC Infiltration Trench U, T, R 3(a), 3(b) Section 8.0 WQ, VC, PC Infiltration Swale U, T, R 3(a), 3(b) Section 8.0 WQ, VC, PC Swales U, T, R 3(a) Section 5.0 WQ, VC Swales with Outlet Control T, R 3(a), 3(a) Section 5.0 WQ, VC, PC Vegetative Filter Strips & Buffers U, T, R 3(a) Section 7.0 WQ, PC Dry Well, Cistern & Rainbarrel U, T, R 3(b) WQ, VC, PC Porous Paving U, T, R 3(b) WQ, VC Curb & Gutter Elimination R 3(b) WQ, PC Rooftop Storage U, T, R 3(b) VC, PC Wet Pond U, T, R 3(b), 3(d) Section 1.0 WQ, VC, PC Extended Dry Pond T, R 3(b), 3(d) Section 6.0 VC, PC Storm Water Wetlands T, R 3(b) Section 2.0 WQ, VC, PC Sand Filter T, R 3(a) Section 3.0 WQ, VC, PC (1) Applicable Zoning Districts: These are the Zoning Districts where the BMP can be used including U = Urban; T = Transitional; R = Rural. (2) Applicable Performance Criteria: These are the Performance Criteria Section numbers (see Section 3) that the BMP can be used to satisfy. (3) Design Function: All BMP designs are contained in the N.C. Department of Environment & Natural Resources, Storm Water Best Management . Practices, April 1999 (4) Functions: These are the dominate functions that the BMPs perform including WQ = Water Quality; VC = Volume Control, PC = Peak Control. Rain Gardens Residential Residential Rain Rain Gardens Gardens Residential Rain Garden Possible Rain Garden Locations Corner Lot Corner Lot Rear Yard Rear Yard Between Lots Roadside Swale Vegetated Vegetated Filter Filter Strip Strip Infiltration Trench Infiltration Trench Roadside Swale Driveway Trench Drain Roadside Swale Rain Barrels Preliminary Plan Preliminary Sketch 109 Lots 80’ Typical Typical Lot Lot 12,000 12,000 S.F. S.F. Woods Woodsto toRemain Remain CN CN Woods Woods 55 55 Lawn 61 Lawn 61 House House 98 98 Drive 98 Drive 98 ½½Street Street 98 98 Patio 98 Patio 98 Sidewalk Sidewalk 98 98 Lawn Patio 150’ House Two -Story House Two-Story House Width Width 60 60’’ Depth Depth 40 40’’ Driveway Lawn Sidewalk 44 Bedrooms Bedrooms 33-1/2 -1/2 Baths Baths 11stst Floor Floor 1456 1456 SF SF nd Floor 22nd Floor 1280 1280 SF SF Total Total Heated Heated 2736 2736 SF SF Pavement SF SF 3200 3200 5830 5830 2000 2000 670 670 1120 1120 300 300 400 400 80’ Typical Typical Lot Lot 12,000 12,000 S.F. S.F. Woods Woodsto toRemain Remain CN CN Woods Woods 55 55 Lawn 61 Lawn 61 House House 98 98 Drive 98 Drive 98 ½½Street Street 98 98 Patio 98 Patio 98 Sidewalk Sidewalk 98 98 Lawn 150’ Fills with 1” of Runoff Two -Story House Two-Story House Rain Width Width 60 60’’ Garden Patio House Driveway Lawn Depth Depth 40 40’’ Sidewalk 44 Bedrooms Bedrooms 33-1/2 -1/2 Baths Baths 11stst Floor Floor 1456 1456 SF SF nd Floor 22nd Floor 1280 1280 SF SF Total Total Heated Heated 2736 2736 SF SF Curb Cut Excess Runoff Over 1” Rainfall Inlet Pavement SF SF 3200 3200 5830 5830 2000 2000 670 670 1120 1120 300 300 400 400 Driveway Driveway Crossing Crossing Roadside Roadside Swale Swale Driveway Driveway Channel Channel // Grate Grate Roadside Swale Capacities Slope 0.50% Slope 1.00% Slope 2.00% Slope 4.00% Slope 5.00% Slope 6.00% Slope 8.00% Q = 1.00 cfs V = 0.51 fps Q = 1.50 cfs V = 0.73 fps Q = 2.10 cfs V = 1.04 fps Q = 2.90 cfs V = 1.47 fps Q = 3.30 cfs V = 1.64 fps Q = 3.60 cfs V = 1.80 fps Q = 4.10 cfs V = 2.07 fps 2’ 2’ –– 6” 6” Gutter Gutter Flow Flow 8’ 8’ –– 0” 0” 5’ 5’ –– 0” 0” 1’-0” 1’-0” 6” 6”Deep Deep Concrete Concrete Curb Curb && Gutter Gutter Channel Channel Flow Flow 3’-4’ 3’-4’ Curb Curb Opening Opening (( Flume Flume )) Water Quality Swale Concrete Concrete Sidewalk Sidewalk S.E.T. Calculations 1. Enter Site Data Here S.E.T. S.E.T. Analysis Analysis Show/Hide Calculation Sheets "Site Data" and "BMPs" worksheets require user inputs. "User BMP" requires user input if the site has a BMP not listed on the "BMPs" sheet Blue colored cells indicate user input fields. Model results are summarized in the "Model Output" worksheet. General Information Name of Applicant: MC Development Co. Name of Project: Forest Lake Estates Scenario Name*: 109 Lot LID # Homes on Septic Systems Unsewered Commercial Systems (gal/yr) Development Site Area (acres): 36.720 Development Site Area (calculated, ft2): 1,599,523 * Use Scenario Name when multiple BMP configurations are being tested for a given project. Save each scenario as a separate file. Soil Hydrologic Groups (Percent of Site Area) Group Group Group Group A B C D 100.00% Check on Soil Group Sums Totals OK Areas assigned in this table must sum to the total development site area. "Pasture" has livestock, while "Meadow" means unmanaged herbaceous cover without livestock. "Driveways and Parking Lots" include curb and gutter. "Rooftops" include canopies. Land Use/Cover Data Existing Land Use Proposed Land Use Area (ft2) % of Site Area (ft2) % of Site 0 0 1,599,523 0 0 0 0.0% 0.0% 100.0% 0.0% 0.0% 0.0% 0 0 435,773 0 0 635,500 0.0% 0.0% 27.2% 0.0% 0.0% 39.7% 0.0% 0.0% 0.0% 0.0% 0.0% 218,000 70,850 32,700 153,700 53,000 13.6% 4.4% 2.0% 9.6% 3.3% Pervious Areas Row Crops Pasture Forest Wetland Meadow Lawn Impervious Areas Residential & Light Industrial Rooftops Driveways & Parking Lots Other Impervious Area Road Sidewalk Commercial & Heavy Industrial Rooftops Parking Lot Other Impervious Area Road Sidewalk Storm Water M anagement Facilities Pond/Wetland Surface Area Swales/Channels/Infiltration Site Totals: Total Site Impervious Cover1 0.0% 0.0% 0.0% 0.0% 0.0% 0 1,599,523 1.0% 0.0% 0.0% 0.0% 0.0% 0.0% 0.0% 0.0% 0 0.0% 0.0% 100.0% 1,599,523 33.7% 100.0% Drainage Areas D.A. 2 D.A. 1 D.A. 3 2. Assign Project Areas Here Assign project area to specific land uses in drainage areas (DA) associated with a specific set of BMPs Hint: Assign land area to the Drainage Areas until all entries in the "Unassigned" category equal 0. Proposed Land Use/ Cover Data by DA Project Unassigned Areas (ft2) Area (ft2) Drainage Areas (DA) associated with B DA1 DA2 DA3 DA4 Pervious Areas Row Crops Pasture Forest Wetland Meadow Lawn Impervious Areas Residential & Light Industrial Rooftops Driveways & Parking Lots Other Impervious Area Road Sidewalk Commercial & Heavy Industrial Rooftops Parking Lot Other Impervious Area Road Sidewalk Storm Water Management Facilities Pond/Wetland All Other BMPs (except Forested Buffer) 0 0 435,773 0 0 635,500 0 0 0 0 0 0 253,773 82,000 100,000 466,900 84,100 84,500 218,000 70,850 32,700 153,700 53,000 0 0 0 0 0 218,000 70,850 32,700 153,700 53,000 0 0 0 0 0 0 0 0 0 0 0 36,000 0 0 1,635,523 0 1,284,923 166,100 Total Area Proposed Drainage Area (DA) assignments match Proposed Land Use. 184,500 36,000 3. Assign BMPs Here a. Click on a box to associate a BMP with a specific DA. BMPs should serve the entire DA. b. Enter storage volume (if applicable) of BMP in acre-ft. BMPs Applied to DA DA1 DA2 DA3 140 100.0% 140 100.0% --- Wet Pond Dry Detention Stormwater Wetland Sand Filter Bioretention (Rain Garden) Enhanced Grass Swale Grass Swale Infiltration Trench User-defined BMP (Sequential with other assigned BMPs) Forested Buffer Enter Buffer Width for each DA with Forested Buffer (feet): Percent of DA within treatment zone: Storage volume for 2 yr, 24 hr storm (acre-ft) 2.3 Notes: Grass channels do not receive removal credit w hen used in combination w ith w ater quality dry sw ales. Forested Buffers cannot be used w ith Wet Ponds, Dry Detention Basins, or Stormw ater Wetlands in the same drainage area. BMP Performance Net Reductions Flow converted to infiltration by BMPs Total Nitrogen Total Phosphorus TSS Fecal Coliform DA1 48.0% 97.4% 96.7% 99.5% 97.3% DA2 10.0% 36.1% 45.0% 69.4% 5.0% DA3 10.0% 36.1% 45.0% 69.4% 5.0% --- DEVELOPMENT PERFORMANCE ANALYSIS MC Development Co. Forest Lake Estates 109 Lot LID Land Use Summary Total Site Area (acres) Pre-development impervious percentage Post-development impervious percentage 36.72 1.0% 33.7% Annual Hydrology Summary Annual Surface Runoff (inches/yr) Annual Infiltration (inches/yr) Existing Landuse 2.32 12.00 Design without BMPs 13.91 7.08 Design with BMPs 7.43 13.57 2-year, 24-hour Storm Event Runoff Volume Summary Storm Runoff Volume Storm Event Runoff Volume (acre-ft) 4.00 acre-ft 3.50 3.00 Existing Landuse Design without BMPs 2.50 Existing Design 2.00 1.50 1.00 0.50 0.00 Existing Design 2-yr, 24-hr BMP Storage Target Storage 1 Meets Goal? 1.16 3.38 2.25 2.22 Yes YES Pollutant Load Summary Existing Landuse 29 2.5 2.41 Total Nitrogen (lb/yr) Total Phosphorus (lb/yr) Sediment 2 (ton/yr) Nitrogen Load Design without BMPs 268 28.6 7.16 35.0 250 30.0 200 25.0 0 0.0 YES Yes 4.00 10.0 5.0 1.07 6.00 15.0 50 Meets Goal? 8.00 20.0 100 Target Sediment Load Phosphorus Load 300 150 Design with BMPs 87 5.9 0.36 2.00 0.00 BMPs Meet Sediment Load Reduction and Runoff Control Targets Fecal Coliform Load Summary Fecal Coliform Load 6000 5000 Fecal Coliform Load (count x 109/yr) 4000 3000 2000 Existing Landuse Design without BMPs Design with BMPs 1000 0 1 Target storage volume is the difference betw een pre-development runoff and design runoff w ith no BMPs. 2 Upland sediment load only, does not include sediment from stream bank erosion/channel instability. Sediment target reflects 85% removal of annual sediment load under design conditions w ithout BMPs. 205 5484 418 Removal Efficiencies: Total Nitrogen: 1.42 lb./acre per year = 67.5% Removal Total Phosphorus: 0.10lb./acre per year = 79.4% Removal Total Suspended Solids: 0.006 Tons/acre per year = 95% Removal Hydrologic Analysis Increase IncreaseTime Timeof ofConcentration Concentration Pre- Developed Flow Length = 1850 LF Post-Developed Flow Length 2650 LF 1. Determine Determinestorage storagevolume volumefor forWater WaterQuality Qualityvolume volumerequirements. requirements.Determine Determine the storage volume required for quality control BMPs. Use larger of volumes toto maintain CN (Step the storage volume required for quality control BMPs. Use larger of volumes maintain CN (Step 1,1, Example 5.2) or water quality volume. (Example 5.3). Example 5.2) or water quality volume. (Example 5.3). 2. Determine Determinestorage storagevolume volumerequired requiredtotomaintain maintainrunoff runoffvolume volumeoror CN. Chart Series A:A:Storage Volume Required toto Maintain the Pre-development CN.Use Use Chart Series Storage Volume Required Maintain the Pre-development 3. 4. Runoff Volume Using Retention Storage (Example 5.2). Runoff Volume Using Retention Storage (Example 5.2). Determine Determinestorage storagevolume volumerequired requiredtotomaintain maintainpredevelopment predevelopmentpeak peakrunoff runoffrate rate using Chart Series B:B:Storage Volume Required toto Maintain the using100% 100%retention. retention.Use Use Chart Series Storage Volume Required Maintain the Predevelopment Peak Runoff Rate Using 100% Retention. Predevelopment Peak Runoff Rate Using 100% Retention. Determine Determinewhether whetheradditional additionaldetention detentionstorage storageisisrequired requiredtotomaintain maintainprepredevelopment the results ofof Steps 11 and 22 toto the results ofof Step 3.3.If If the developmentpeak peakrunoff runoffrate. rate.Compare Compare the results Steps and the results Step the storage volume inin Steps 11 and 22 is is determined toto bebe greater than that inin Step 3,3, the storage volume required toto storage volume Steps and determined greater than that Step the storage volume required maintain the predevelopment CN also controls the peak runoff rate. NoNo additional detention storage is is needed. maintain the predevelopment CN also controls the peak runoff rate. additional detention storage needed. If If the site area inin Step 11 is is less than that inin Step 3,3, additional detention storage is is required toto maintain the peak the site area Step less than that Step additional detention storage required maintain the peak runoff rate (Example 5.4). runoff rate (Example 5.4). Determine Determinestorage storagevolume volumerequired requiredtotomaintain maintainpredevelopment predevelopmentpeak peakrunoff runoffrate rate using Chart Series C:C:Storage Volume Required toto Maintain the using100% 100%detention. detention.Use Use Chart Series Storage Volume Required Maintain the 5. Predevelopment Peak Runoff Rate Using 100% Detention. is is used inin conjunction with Chart Series Predevelopment Peak Runoff Rate Using 100% Detention.This This used conjunction with Chart Series AA and BB toto determine the hybrid volume inin Step 6.6. and determine the hybrid volume Step HYBRID results from Chart Series A,A, B,B, and CC toto determine storage HYBRIDapproach. approach.Use Use results from Chart Series and determine storage 6. volume s to maintain both the predevelopment peak runoff rate and runoff volume. toto volume s to maintain both the predevelopment peak runoff rate and runoff volume.Refer Refer Equations 5.5 and 5.6 asas found inin Example 5.4. Equations 5.5 and 5.6 found Example 5.4. 7. Determine Determineappropriate appropriatestorage storagevolume volumeavailable availablefor forretention retentionpractices. practices.If Ifthethe storage volume available for retention practices is less than the storage determined inin Step 3,3, storage volume available for retention practices is less than the storage determined Step recalculate the amount of BMP area required to maintain the peak runoff rate while attenuating recalculate the amount of BMP area required to maintain the peak runoff rate while attenuating some volume using the procedure inin Example 5.6 using Equations 5.7 and 5.8. some volume using the procedure Example 5.6 using Equations 5.7 and 5.8. Summary Volume to maintain pre-developed volume = 0.49". 1.50 Ac.Ft. ( 2 year storm) Water Quality Volume (Impervious Area) =0.79", 0.798 Ac. Ft. (1" Rainfall ) Retention storage to maintain Peak Rate of Runoff = 0.99", 3.03 Ac. Ft. (10 Yr. Storm) Detention storage to maintain Peak Rate of Runoff = 0.83", 2.54 Ac. Ft (10 Yr. Storm). Total Volume required to maintain Peak Rate of runoff = 0.726". 2.222 Ac. Ft ( HYBRID ). Therefore: Use 0.798 Ac. Ft in "Rain Gardens" and 1.424 Ac. Ft. in Dry Detention Final Conceptual Plan Conceptual Layout 109 Lots Steep Steep Slopes Slopes 100’ 100’ Buffer Buffer Floodplain Floodplain Rain Rain Gardens Gardens 100’ 100’ Buffer Buffer Rain Rain Gardens Gardens Dry Dry Detention Detention Basin Basin Forest Lake Estates Vermillion Vermillion Phase Phase 55 Any Questions ??

