SPEECH INVERSION: BENEFITS OF TRACT VARIABLES OVER PELLET TRAJECTORIES
advertisement

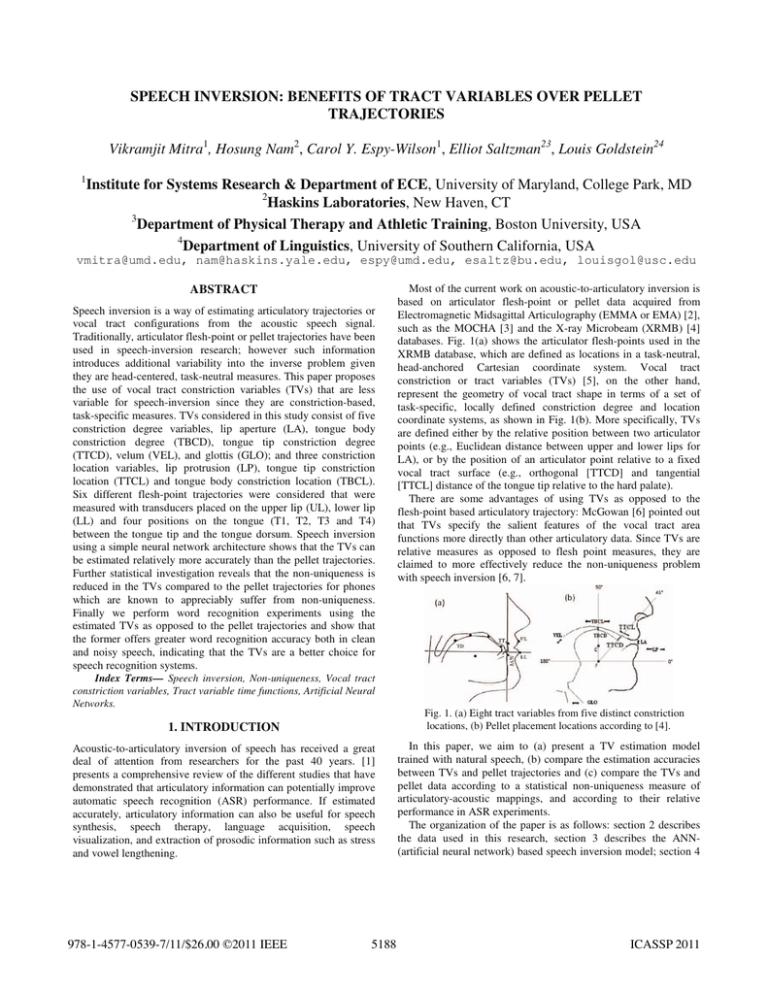
SPEECH INVERSION: BENEFITS OF TRACT VARIABLES OVER PELLET TRAJECTORIES Vikramjit Mitra1, Hosung Nam2, Carol Y. Espy-Wilson1, Elliot Saltzman23, Louis Goldstein24 1 Institute for Systems Research & Department of ECE, University of Maryland, College Park, MD 2 Haskins Laboratories, New Haven, CT 3 Department of Physical Therapy and Athletic Training, Boston University, USA 4 Department of Linguistics, University of Southern California, USA vmitra@umd.edu, nam@haskins.yale.edu, espy@umd.edu, esaltz@bu.edu, louisgol@usc.edu ABSTRACT Speech inversion is a way of estimating articulatory trajectories or vocal tract configurations from the acoustic speech signal. Traditionally, articulator flesh-point or pellet trajectories have been used in speech-inversion research; however such information introduces additional variability into the inverse problem given they are head-centered, task-neutral measures. This paper proposes the use of vocal tract constriction variables (TVs) that are less variable for speech-inversion since they are constriction-based, task-specific measures. TVs considered in this study consist of five constriction degree variables, lip aperture (LA), tongue body constriction degree (TBCD), tongue tip constriction degree (TTCD), velum (VEL), and glottis (GLO); and three constriction location variables, lip protrusion (LP), tongue tip constriction location (TTCL) and tongue body constriction location (TBCL). Six different flesh-point trajectories were considered that were measured with transducers placed on the upper lip (UL), lower lip (LL) and four positions on the tongue (T1, T2, T3 and T4) between the tongue tip and the tongue dorsum. Speech inversion using a simple neural network architecture shows that the TVs can be estimated relatively more accurately than the pellet trajectories. Further statistical investigation reveals that the non-uniqueness is reduced in the TVs compared to the pellet trajectories for phones which are known to appreciably suffer from non-uniqueness. Finally we perform word recognition experiments using the estimated TVs as opposed to the pellet trajectories and show that the former offers greater word recognition accuracy both in clean and noisy speech, indicating that the TVs are a better choice for speech recognition systems. Most of the current work on acoustic-to-articulatory inversion is based on articulator flesh-point or pellet data acquired from Electromagnetic Midsagittal Articulography (EMMA or EMA) [2], such as the MOCHA [3] and the X-ray Microbeam (XRMB) [4] databases. Fig. 1(a) shows the articulator flesh-points used in the XRMB database, which are defined as locations in a task-neutral, head-anchored Cartesian coordinate system. Vocal tract constriction or tract variables (TVs) [5], on the other hand, represent the geometry of vocal tract shape in terms of a set of task-specific, locally defined constriction degree and location coordinate systems, as shown in Fig. 1(b). More specifically, TVs are defined either by the relative position between two articulator points (e.g., Euclidean distance between upper and lower lips for LA), or by the position of an articulator point relative to a fixed vocal tract surface (e.g., orthogonal [TTCD] and tangential [TTCL] distance of the tongue tip relative to the hard palate). There are some advantages of using TVs as opposed to the flesh-point based articulatory trajectory: McGowan [6] pointed out that TVs specify the salient features of the vocal tract area functions more directly than other articulatory data. Since TVs are relative measures as opposed to flesh point measures, they are claimed to more effectively reduce the non-uniqueness problem with speech inversion [6, 7]. Index Terms— Speech inversion, Non-uniqueness, Vocal tract constriction variables, Tract variable time functions, Artificial Neural Networks. Fig. 1. (a) Eight tract variables from five distinct constriction locations, (b) Pellet placement locations according to [4]. 1. INTRODUCTION Acoustic-to-articulatory inversion of speech has received a great deal of attention from researchers for the past 40 years. [1] presents a comprehensive review of the different studies that have demonstrated that articulatory information can potentially improve automatic speech recognition (ASR) performance. If estimated accurately, articulatory information can also be useful for speech synthesis, speech therapy, language acquisition, speech visualization, and extraction of prosodic information such as stress and vowel lengthening. 978-1-4577-0539-7/11/$26.00 ©2011 IEEE 5188 In this paper, we aim to (a) present a TV estimation model trained with natural speech, (b) compare the estimation accuracies between TVs and pellet trajectories and (c) compare the TVs and pellet data according to a statistical non-uniqueness measure of articulatory-acoustic mappings, and according to their relative performance in ASR experiments. The organization of the paper is as follows: section 2 describes the data used in this research, section 3 describes the ANN(artificial neural network) based speech inversion model; section 4 ICASSP 2011 presents a Mixture Density Network (MDN) based statistical analysis framework grounded on the concepts described in [8] for evaluating non-uniqueness in the speech inversion task; section 5 describes the design of our ASR word recognition experiments; and section 6 discusses the results from section 3, 4 and 5. 2. THE SPEECH DATABASE AND ITS PARAMETERIZATION In [9] we described a method for annotating natural speech utterances with TV trajectories. In our current work, we have applied this method to the entire XRMB database, generating eight TV trajectories that are defined by the location and degree of different constrictions in the vocal tract (see Table 1). Each TV trajectory is sampled at 200Hz. The XRMB database contains pellet trajectory (PT) data (sampled at 145.65Hz) recorded along with the speech waveforms (sampled at 21.74 kHz). The pellets were placed on the upper lip (ULx, ULy), lower lip (LLx & LLy), tongue tip (T1x & T1y), midtongue (T2x, T2y, T3x & T3y) and tongue dorsum (T4x & T4y), where the subscripts x, y represent the horizontal and vertical coordinates of each pellet, resulting in 12 channels of flesh-point data. The database includes speech utterances recorded from 47 different American English speakers, each producing at most 56 read-speech tasks consisting of strings of digits, TIMIT sentences, and paragraph(s) from a book. Our work uses the acoustic data, TVs and PTs for the 56 tasks performed by male speaker 12 from the XRMB database: 76.8% of the data was used for training, 10.7% for validation and the rest for testing. The PTs were upsampled to 200Hz to synchronize with the sampling rate of the TVs. The acoustic signals were downsampled to 16KHz and parameterized as (a) MFCCs, (b) LPCC and (c) PLPCC. For each parameterization, 20 coefficients were selected that were analyzed at a frame rate of 5ms with a window duration of 10ms. The acoustic features and the articulatory data (PT and TV) were znormalized. The resulting acoustic coefficients were scaled such that their dynamic range was confined within [-0.95, +0.95]. It has been observed [7, 10] that incorporating dynamic information helps to reduce the non-uniqueness problem for the speech inversion task; hence the acoustic features were temporally contextualized in all the experiments reported here. Specifically, 20 acoustic coefficients were obtained from each of nine 10mswindows (middle window centered at the current time with preceding and following windows separated by 20ms intervals), thereby covering 170ms of speech. This acoustic information was concatenated into a contextualized acoustic feature vector with a dimensionality of 180 (= 9×20). The ASR experiments reported below were performed on the Aurora-2 [11] database that consists of connected digits spoken by American English speakers, sampled at 8 kHz. We used Aurora-2’s test set A & B that contain eight noise types at seven SNR levels. Table 1. Constriction organ, vocal tract variables Constriction organ Lip Tongue Tip Tongue Body Velum Glottis VT variables Lip Aperture (LA) Lip Protrusion (LP) Tongue tip constriction degree (TTCD) Tongue tip constriction location (TTCL) Tongue body constriction degree (TBCD) Tongue body constriction location (TBCL) Velum (VEL) Glottis (GLO) 5189 3. THE ARTIFICIAL NEURAL NETWORK BASED SPEECH INVERSION MODEL Speech inversion is a transform from the acoustic domain to the articulatory domain. ANNs have been used by many investigators [10, 12, 13] for speech inversion tasks. Once trained, ANNs require comparatively low computational resources compared to other methods both in terms of memory and execution speed [10]. ANNs have the advantage of allowing multiple inputs (dim M) and outputs (dim N). Using an ANN architecture, the same hidden layers are shared by all N outputs, which allows the ANN to exploit any cross-correlation that the outputs may have among themselves. In our work, we trained separate FF- (feedforward) ANNs to learn the inverse mappings between acoustics and either PTs or TVs. As described in the previous section, the dimension of our input acoustic vector was M = 180. The dimensions of our output vectors were N = 8 for the TVs and N = 12 for the PTs. All FF-ANNs were trained with backpropagation using a scaled conjugate gradient algorithm. Since the articulatory trajectories estimated using FF-ANNs are noisy, we smoothed them with a Kalman smoother [7]. The resultant trajectories were consistent with the observation [14] that articulatory motions are predominantly low pass in nature with a cut-off frequency of 15 Hz. 4. STATISTICAL ANALYSIS OF NON-UNIQUENESS Our statistical analysis of non-uniqueness in speech-inversion is motivated by the work presented in [8]. In this approach the conditional probability function of the inversion, p(A|st) is first estimated, where A is the articulatory space and st is the acoustic vector at time instant t. We use an MDN (instead of the Gaussian Mixture Model (GMM) used in [8]) to estimate p(A|st) from acoustic and articulatory data in each phone context. MDNs [15] combine a conventional feedforward ANN with a mixture model (usually a GMM). In an MDN, the ANN maps the input vector to the parameters of a GMM that generates a conditional probability density function (pdf) of the output conditioned on the input. In a GMM, the probability density of the output data a conditioned on the input s, can be represented as m p ( a | s ) = ¦ α i ( s ) ki ( a | s ) (1) i =1 where Įi(s) is the prior probability, ki(a|s) is the conditional probability density given the ith Gaussian kernel, and m is the number of Gaussian mixtures. Each Gaussian kernel is defined by ª a − μ (s) 2 º 1 i » exp « − (2) ki ( a | s ) = 2 c 0.5 c « (2π ) σ i ( s ) 2σ i ( s ) » ¬ ¼ where ȝi(x) is the center of the ith kernel, ıi(x) is the spherical covariance (this assumption can be relaxed by considering either a diagonal or a full covariance) for each Gaussian kernel, and c is the input dimension. The ANN part of the MDN is responsible for computing the mapping from the input space s to the control parameters of the mixture model (priors Į, means ȝ and variances ı2) that, in turn, defines the conditional pdf of the output a conditioned on the input s, p(a|s), i.e., the conditional probability of the articulatory configuration a given the acoustic speech signal s. According to [8], non-uniqueness in speech inversion exists when the conditional probability function p(a|s) exhibits more than one probable articulatory configuration (by having multiple peaks) for a given acoustic observation. In such a case, the degree of non- uniqueness in the inverse mapping can be quantified using the deviations of the peaks of the conditional probability function p(a|s) from the mean peak location. We have used the unit-less Normalized Non-Uniqueness (NNUt) measure as proposed in [8], which is defined as Q NNU t = ¦ P (M q q − μ t )T ( Σ t ) − 1 ( M q − μ t ) q =1 Pq = (3) pa| s (a = M q | st ) ¦ Q q =1 pa |s (a = M q | st ) where Q is the number of local maxima (or the peaks) at locations Mq (1 q Q), Pq is the normalized probability defined in (3), ȝt is the mean location of the peaks and Ȉt is the variance of the conditional probability function. Since NNU provides a measure of the spread of the local peaks in the conditional pdf, p(a|s), a lower NNU indicates a lower degree of non-uniqueness in the mapping. Note that for a perfectly unique mapping, we can expect to have only one peak for p(a|s), indicating Mq = ȝt, implying NNU = 0. 5. ASR EXPERIMENT Finally, we evaluated the relative utility of TVs and PTs in simple word recognition tasks. For these ASR experiments we used the HTK-based speech recognizer distributed with the Aurora-2 corpus [11]. The recognizer incorporates a hidden Markov model (HMM) backend that uses eleven whole word HMMs, each with 16 states (in addition to 2 dummy states) with each state having three Gaussian mixture components. Two pause models, one for ‘‘sil” and one for ‘‘sp”, are used; the ‘‘sil” model has three states and each state has six mixtures, while the ‘‘sp” model has only a single state with three mixtures. Training in the clean condition and testing in the noisy scenario is used in all of our experiments. The HMMs were trained with three different observation sets (a) MFCC, (b) MFCC + estimated TVs, (c) MFCC + estimated PTs. Note that the sampling rate for the Aurora-2 database is 8KHz; hence, both the TV estimator and the PT estimator had to be retrained with 8KHz sampled XRMB data. 6. RESULTS Feedforward ANN architectures (FF-ANNs) with 3 hidden layers and with tanh-sigmoid activation functions were implemented for the inversion models. Six different FF-ANN architectures were used, according to the particular combination of acoustic feature inputs (MFCC, LPCC or PLPCC) and articulatory outputs (TVs or PTs) that were investigated. Each FF-ANN architecture had as many output nodes as there were articulatory channels (8 channels for TVs and 12 for PTs). The optimal number of nodes in each hidden layer was obtained by maximizing the Pearson productmoment correlation (PPMC) coefficient (rPPMC) between the actual or groundtruth (t) and the estimated (e) articulatory trajectories for the development set. Note that the groundtruth PTs were simply taken from the XRMB corpus; the groundtruth TVs were generated using the method in [9] applied to the XRMB acoustic data. PPMC coefficients were computed using equation (4) ª N ºª N º N ¦ eiti − « ¦ ei » « ¦ ti » i =1 ¬ i =1 ¼ ¬ i =1 ¼ We refrained from adding any additional hidden layer beyond the 3rd as with increase in the number of hidden layers: (a) the error surface became more complex with a large number of spurious minima; (b) the training time as well as the network complexity increased; and (c) no appreciable improvement was observed. The ANNs were trained with a training epoch of 4000 and their outputs were processed with a Kalman smoother. Table 2 presents the overall rPPMC between the groundtruth and the estimated articulatory data averaged across all 12 channels for PT data and across 6 channels for TV data (note: GLO and VEL TVs are excluded for the comparison because there are no counterparts in the pellet data), that was obtained using each of the different acoustic parameterizations. rPPMC for the estimated TVs were higher overall than for the estimated PTs, demonstrating that TVs were estimated more accurately by the FF-ANNs. The rPPMC of TV estimates obtained from the different parameterizations were quite similar to each other, indicating the invariance of the TV estimation accuracies for different acoustic parameters considered; which was not found to hold so strongly for the PTs. Table 3 compares the obtained rPPMC between individual TV and pellet estimates. Taken together, Tables 2 and 3 indicate that TVs can be estimated more accurately than PTs from the speech signal. McGowan [6] suggested that, since TVs are relative measures, they can be expected to suffer less from non-uniqueness than PTs, which can be the reason why the former are estimated more accurately than the latter. To analyze and quantify nonuniqueness in the speech inversion models using TVs and PTs as outputs, we used the approach described in section 4. Since [8, 16] showed that non-uniqueness is commonly observed mostly for consonants, we selected the six consonants (/r/, /l/, /p/, /k/, /g/ and /t/) that these studies showed to be most affected by nonuniqueness. A single MDN with 100 hidden layers and 16 mixture components with spherical Gaussian mixtures, was trained for 2500 iterations for each articulatory channel in each phone context, where the acoustic observations were parameterized as Table 2. rPPMC averaged across all trajectories for TV and Pellet data using different acoustic parameterization. The numbers in the parentheses denote the number of neurons used in each of the 3 hidden layers. TV trajectory Pellet trajectory MFCC 0.819 PLPCC 0.817 LPCC 0.817 (250-150-225) (175-100-125) (150-100-225) 0.758 0.745 0.703 (250-125-75) (200-75-150) (150-125-225) Table 3. Comparison of rPPMC between relevant articulatory pellet and TV data using MFCC as the acoustic parameterization. Pellets TVs rPPMC rPPMC LP 0.852 LA 0.786 TTCL 0.814 TTCD 0.794 TBCL 0.838 TBCD 0.831 Avg 0.819 N rPPMC = § N · N ¦ ei2 − ¨ ¦ ei ¸ i =1 © i =1 ¹ N 2 § N · N ¦ ti2 − ¨ ¦ ti ¸ i =1 © i =1 ¹ N (4) 2 5190 LLx ULx LLy ULy T1y T1x T2y T2x T3y T3x T4y T4x Avg 0.822 0.773 0.844 0.676 0.903 0.887 0.918 0.883 0.775 0.491 0.706 0.422 0.758 contextualized MFCCs (as specified in section 2). We computed the Normalized Non-uniqueness (NNU) measure for the data in the testing set. As shown in Fig. 3, the NNU score of TVs is almost always lower than that of the PTs, indicating that the inverse mapping between acoustics and TVs is less non-unique compared to that between acoustics and PTs. Fig. 4 compares the word recognition accuracy obtained from the word recognition experiments using the Aurora-2 database, where the accuracies at a given SNR are averaged across all the noise types. Fig. 4 shows that adding the estimated TVs or the PTs to the MFCCs improved the word recognition accuracy compared to the system using MFCCs only. However, the improvement is higher for TVs, which further emboldens the strength of TVs. Across the Street 4000 Frequency AH0 K AO R S DH S AH0 T R IY T 3000 2000 1000 0 0.1 0.2 0.3 0.4 0.5 0.6 0.7 0.8 0.9 Time (sec) 0.5 0 Actual Estimated −0.5 LA −1 0.1 0.2 0.3 0.4 0.5 0.6 0.7 0.8 0.9 0.1 0.2 0.3 0.4 0.5 0.6 0.7 0.8 0.9 0.1 0.2 0.3 0.4 0.5 0.6 0.7 0.8 0.9 0.1 0.2 0.3 0.4 0.5 0.6 0.7 0.8 0.9 1 0 −1 LP −2 0.5 0 −0.5 TBCD −1 1 0.5 TTCD 0 Fig. 2. Plot of the actual and estimated TVs (LA, LP, TBCD & TTCD) for utterance “across the street” 0.9 Lips (Pellet) TT (Pellet) TB (Pellet) Lips (TV) TT (TV) TB (TV) 0.8 0.7 0.6 0.5 0.4 R L P K G T Fig. 3. Graph comparing the Normalized Non-uniqueness measure (NNU) for speaker 12 in XRMB database across 6 different phonemes (/r/, /l/, /p/, /k/, /g/ & /t/) for Lips, Tongue-Tip (TT) and Tongue-Body (TB) pellet-trajectories and TVs. 100 MFCC MFCC+TV MFCC+PT Rec Acc % 80 60 40 20 0 Clean 20dB 15dB 10dB SNR (dB) 5dB 0dB −5dB Fig. 4. Average word recognition accuracy (averaged across all the noise types) for MFCC only, MFCC+TV and MFCC+PT 7. CONLUSION We have demonstrated that TVs can be estimated more accurately than PTs using three different speech parameterizations. While the TV-based inverse model was relatively independent of the differences in speech parameterization, the pellet-based model was not. Further, using a model-based statistical paradigm, we showed that non-uniqueness in the TV-based inverse model was comparatively lower than the pellet-based model for six consonants. We also showed in a word recognition experiment that TVs perform better than PTs when used along with MFCCs, indicating that TVs provide a better representation for ASR than PTs. Future work should consider performing non-uniqueness analyses across other phone contexts and across multiple speakers. 8. REFERENCES [1] S. King, J. Frankel, K Livescu, E. McDermott, K Richmond and M. Wester, “Speech production knowledge in automatic speech recognition”, J. of Acoust. Soc. of Am., 121(2), pp. 723-742, 2007. [2] J. Ryalls and S. J. Behrens, Introduction to Speech Science: From Basic Theories to Clinical Applications, Allyn & Bacon, 2000. [3] A.A. Wrench and H.J. William, “A multichannel articulatory database and its application for automatic speech recognition”, In 5th Seminar on Speech Production: Models and Data, pp. 305–308, Bavaria, 2000. [4] Westbury “X-ray microbeam speech production database user’s handbook”, Univ. of Wisconsin, 1994. [5] E. Saltzman and K. Munhall, “A Dynamical Approach to Gestural Patterning in Speech Production”, Ecological Psychology, 1(4), pp. 332-382, 1989. [6] R.S. McGowan, “Recovering articulatory movement from formant frequency trajectories using task dynamics and a genetic algorithm: preliminary model tests”, Speech Communication, Vol.14, Iss.1, pp. 19-48, Elsevier Science Publishers, 1994. [7] V. Mitra, H. Nam, C. Espy-Wilson, E. Saltzman and L. Goldstein, Retrieving Tract Variables from Acoustics: a comparison of different Machine Learning strategies, IEEE Journal of Selected Topics on Signal Processing, Vol. 4, Iss. 6, pp. 1027-1045, 2010. [8] G. Ananthakrishnan, D. Neiberg and O. Engwall, “In search of Non-uniqueness in the Acoustic-to-Articulatory Mapping”, in Proc. of Interspeech, pp. 2799-2802, Brighton, UK, 2009. [9] H. Nam, V. Mitra, M. Tiede, E. Saltzman, L. Goldstein, C. EspyWilson and M. Hasegawa-Johnson, “A procedure for estimating gestural scores from natural speech”, Proc. of Interspeech, pp. 30-33, Japan, 2010. [10] K. Richmond, Estimating Articulatory parameters from the Acoustic Speech Signal, PhD Thesis, Univ. of Edinburgh, 2001. [11] H.G. Hirsch and D. Pearce, “The Aurora experimental framework for the performance evaluation of speech recognition systems under noisy conditions”, In Proc. ISCA ITRW ASR2000, pp. 181-188, Paris, France, 2000. [12] G. Papcun, J. Hochberg, T.R. Thomas, F. Laroche, J. Zachs and S. Levy, “Inferring articulation and recognizing gestures from acoustics with a neural network trained on X.ray microbeam data”, J. Acoust. Soc. of Am., 92(2), pp. 688-700. [13] J. Zachs and T.R. Thomas, “A new neural network for articulatory speech recognition and its application to vowel identification”, Comp. Speech & Language, 8, pp. 189-209, 1994. [14] J. Hogden, D. Nix and P. Valdez, “An Articulatorily Constrained, Maximum Likelihood Approach to Speech Recognition”, Tech. Report, LA-UR--96-3945, Los Alamos National Laboratory, 1998. [15] C. Bishop, “Mixture density networks”, Tech. Report NCRG/4288, Neural Computing Research Group, Dept. of Comp. Sc., Aston Univ., Birmingham, U.K. [16] D. Neiberg, G. Ananthakrishnan and O. Engwall, “The Acoustic to Articulation Mapping: Non-linear or Non-unique?”, Proc. of Interspeech, pp.1485-1488, Australia, 2008. 5191


