A CINE MRI-BASED STUDY OF SIBILANT FRICATIVES PRODUCTION IN POST-
advertisement
A CINE MRI-BASED STUDY OF SIBILANT FRICATIVES PRODUCTION IN POSTGLOSSECTOMY SPEAKERS
Xinhui Zhou1, Jonghye Woo2, Maureen Stone2, Carol Espy-Wilson1
1
Department of Electrical and Computer Engineering, University of Maryland, College Park, USA
Departments of Neural and Pain Sciences and Orthodontics, University of Maryland Dental School, Baltimore, USA
1
{zxinhui, espy@umd.edu}, 2{jschant@gmail.com, mstone@umaryland.edu}
2
ABSTRACT
Glossectomy changes properties of the tongue and negatively
affects patients’ speech production. Among the most difficult
consonants to produce in the post-glossectomy speakers, the
sibilant fricatives /s/ and /sh/ are often problematic. To better
understand these problems in production, this study analyzed
acoustic and articulatory data of /s/ and /sh/ from three subjects:
one normal speaker and two post-glossectomy speakers with
abnormal /s/ or /sh. Based on cine magnetic resonance images,
three dimensional vocal tract reconstructions, tongue surface
shapes behind constrictions, and area functions were analyzed. Our
results show that in each patient, contrary to normal, /s/ and /sh/
were quite similar in acoustic spectra, tongue surface shapes, and
constriction locations. In the abnormal /s/, the missing unilateral
tongue tissue created an air flow bypass which made the
constriction further backward. The abnormal /sh/ may be explained
by the lack of precise tongue control after surgery. In addition, the
tongue surfaces in the patients were more asymmetric in the back
and were not grooved for /s/ anterior to the constriction.
Index Terms—Sibilant fricatives /s/ and /sh/, glossectomy,
cine magnetic resonance image, vocal tract, tongue surface shape
1. INTRODUCTION
Glossectomy is a surgery to remove the cancerous tumor of the
tongue plus about 1 cm of tissue around it. After the surgery, the
resection site of the tongue is sutured and closed, or a flap is
inserted to reconstruct the tongue volume. As a result, the
properties of tongue such as volume, motility, and muscle
structures may be changed. Thus, the critical function of speech in
these patients may be affected negatively, as might chewing and
swallowing [1-2]. Speech outcome after glossectomy depends on
many factors such as the tumor size, its location, the reconstruction
strategy or the affected muscles [3-6]. In general, the intelligibility
of consonants after glossectomy is deteriorated more than vowels.
Sibilant fricatives /s/ and /sh/ are among the most difficult
consonants to produce correctly for the post-glossectomy speakers
particularly for the anterior tongue resection [6]. /s/ is often
confused with /sh/. Our previous acoustic study [7] showed that /s/
and /sh/ spectra from glossectomy speakers tend to have lower
centers of gravity than normal speakers. In addition, our previous
study on /s/ articulation [8] showed that patients may prefer to use
laminal tongue shapes for /s/ due to reduced control of the tongue
tip. However, the relationship between the articulation of /s/ and
/sh/ in patients and its corresponding acoustics for glossectomy
patients is still not clear, particularly for those problematic
productions.
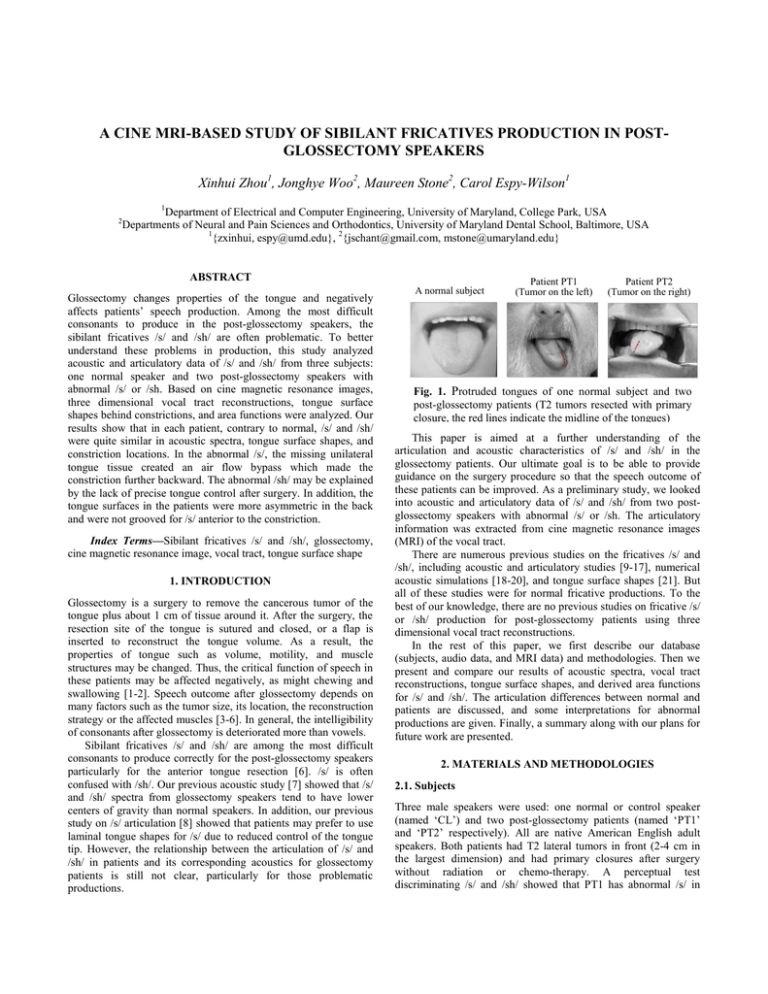
A normal subject
Patient PT1
(Tumor on the left)
Patient PT2
(Tumor on the right)
Fig. 1. Protruded tongues of one normal subject and two
post-glossectomy patients (T2 tumors resected with primary
closure, the red lines indicate the midline of the tongues)
This paper is aimed at a further understanding of the
articulation and acoustic characteristics of /s/ and /sh/ in the
glossectomy patients. Our ultimate goal is to be able to provide
guidance on the surgery procedure so that the speech outcome of
these patients can be improved. As a preliminary study, we looked
into acoustic and articulatory data of /s/ and /sh/ from two postglossectomy speakers with abnormal /s/ or /sh. The articulatory
information was extracted from cine magnetic resonance images
(MRI) of the vocal tract.
There are numerous previous studies on the fricatives /s/ and
/sh/, including acoustic and articulatory studies [9-17], numerical
acoustic simulations [18-20], and tongue surface shapes [21]. But
all of these studies were for normal fricative productions. To the
best of our knowledge, there are no previous studies on fricative /s/
or /sh/ production for post-glossectomy patients using three
dimensional vocal tract reconstructions.
In the rest of this paper, we first describe our database
(subjects, audio data, and MRI data) and methodologies. Then we
present and compare our results of acoustic spectra, vocal tract
reconstructions, tongue surface shapes, and derived area functions
for /s/ and /sh/. The articulation differences between normal and
patients are discussed, and some interpretations for abnormal
productions are given. Finally, a summary along with our plans for
future work are presented.
2. MATERIALS AND METHODOLOGIES
2.1. Subjects
Three male speakers were used: one normal or control speaker
(named ‘CL’) and two post-glossectomy patients (named ‘PT1’
and ‘PT2’ respectively). All are native American English adult
speakers. Both patients had T2 lateral tumors in front (2-4 cm in
the largest dimension) and had primary closures after surgery
without radiation or chemo-therapy. A perceptual test
discriminating /s/ and /sh/ showed that PT1 has abnormal /s/ in
Control CL
Patient PT1
Patient PT2
Fig. 2.Acoustic spectra of /s/ and /sh/ for the three subjects. a) /s/ in “a souk” vs. /sh/ in “a shell”, b) /s/ vs. /sh/ in the
context of /iy/, c) /s/ vs. /sh/ in the context of /ah/ (thin and blue lines for /sh/ and thick and red lines for /s/)
Control CL
Patient PT1
Patient PT2
minimize jaw motion, thus increasing tongue deformation. The
audio data was acquired by a miniature digital recorder (Olympus
300M) and was downsampled at 16 kHz.
2.3. MRI data
Cine-MRI data was collected for the MRI words using the
following parameters: 3.0 T Siemens Tim Treo; frame rate 26 Hz;
in-plane resolution: 1.875 mm/pixel; slice thickness: 6 mm; 3
orthogonal image stacks (sagittal, coronal, and axial) acquired.
2.3. Methods of data analysis
Fig. 3. Mid-sagittal MR images of /s/ and /sh/ for the
three subjects. A) /s/ in “a souk”, B) /sh/ in “a shell”
words “isi”, “asa”, “usu”, and “ese”, and PT2 has abnormal /sh/ in
“ishi”.
Their protruded tongues are shown in Fig. 1. The missing
tissue in patients makes the tongue bend on protrusion towards one
side depending on the tumor location. The tongue motility was
assessed by asking the subjects to rapidly repeat multiple
repetitions of /t/. In 10 seconds, CL repeated /t/ 80 times, whereas
PT1 did it 67 times, PT2 only 22 times.
2.2. Speech data
Vowel-consonant-vowel (VCV) words and words used in MR
imaging sessions were recorded outside the MRI machine for each
subject. VCV words were used in our perceptual test
discriminating /s/ and/sh/, and vowels consist of /iy/, /ah/, /uw/,
/eh/. The MRI words “a souk” and “a shell” were chosen as the
speech task during the MRI session because they take less than 1
second to repeat, which is within the limits of our MRI recording
system in getting tag images (not used in this study). They also
Acoustic spectra were estimated over 80 ms segments using a
multi-taper analysis [22] which showed some advantage in
minimizing the estimation variance of power spectrum [23]. The 3D vocal tracts were segmented for articulation details. We first
created an isotropic volume (resolution 1.875 mm in each voxel)
by applying a super-resolution technique [24] on the three stacks.
Then we segmented the airway by threshholding. Based on the
segmented vocal tract, we derived the tongue surface shapes and
also extracted area functions models by a centerline method [25]
which is based on region-growing to get the centroids.
3. RESULTS
3.1. Acoustic spectra
Fig. 2 shows the acoustic spectra of /s/ and /sh/ at different
contexts. In general, /s/ has a spectral peak at higher frequency
than /sh/ and more energy in 3.5-5 kHz (as opposed to 2.5-3.5 kHz)
[26]. In CL, the spectra peaks for /s/ and /sh/ are normal and
distinctive. In PT1, the spectral peaks for both /s/ and /sh/ appear
below 3 kHz, so /s/ is problematic. In PT2, the spectra peaks for
both /s/ and /sh/ appear at about 4 kHz, and /sh/ is problematic. But
/sh/ in “asha” for PT2 is perceived correctly in the perceptual test,
probably due to its high spectral amplitude at around 2 kHz.
3.2. Midsagittal tongue shapes and reconstructed vocal tracts
A)
B)
C)
D)
Fig. 4.Vocal tract reconstructions of /s/ and /sh/. A) /s/ of CL, B) /sh/ of CL, C) /s/ of PT1, and D) /sh/ of PT2 (From left to
right: Midsagittal MR slice, coronal MR slice at the constriction, axial and sagittal view of the 3-D shapes)
Fig. 3 shows the mid-sagittal MR images of /s/ and /sh/. In CL, the
tongue shapes for /s/ and /sh/ are contrasted well (apical /s/ vs.
laminal /sh/). The area posterior to the constriction in /s/ is much
larger than in /sh/. In both PT1 and PT2, the tongue shapes for /s/
and /sh/ are similar, and the area difference posterior to the
constriction is much smaller compared to that in CL. In addition,
the constriction for /s/ in patients are further back than in the
normal.
The 3-D vocal tract reconstructions are shown in Fig. 4. Due to
the space limitation, /sh/ of PT1 and /s/ of PT2 are not shown.
There are two main observations on the difference between
patients and normal. First, patients have a larger front cavity than
the normal due to the reduced tongue volume in the front; Second,
the missing tongue tissue may create a bypass of air flow (as in /s/
of PT1) or a side branch (as in /sh/ of PT2). These differences may
make the articulatory configuration in patients (such as the
constriction location and the front cavity dimension) deviated from
its target.
3.4. Tongue surface shapes
Fig. 5 shows the tongue surface shapes behind the constriction of
/s/ (red) and /sh/ (pink) in the sagittal, coronal and surface images.
/s/ and /sh/ in PT1 and PT2 have similar tongue surface shapes, so
only surfaces for /s/ are shown. In CL, as expected, /s/ is more
grooved in the front than /sh/ and both sounds are grooved in the
back and approximately symmetrical (see the tongue surface and
coronal views). /s/ in the patients is not grooved behind the
constriction, and obviously asymmetrical in the back. In the back,
the side without resection is higher than the other side. This may be
a compensatory mechanism to create a proper constriction for /s/.
3.3. Vocal tract area functions
Fig. 6 shows the vocal tract area functions. Recall that the peak
spectral frequencies of /s/ and /sh/ are strongly correlated to the
front cavity length or the constriction location [11]. In CL, /s/ and
/sh/ have different constriction locations (Fig 6, red dashed lines)
which accordingly produce different peak spectral frequencies. In
each patient, /s/ and /sh/ have similar constriction locations, which
make /s/ for PT1 and /sh/ for PT2 problematic. In PT1, the air flow
bypass created by the missing tongue makes the constriction in the
area function for /s/ more backward. In PT 2, the reason /sh/ has a
more forward constriction is not straightforward and is discussed in
the next section.
A)
B)
C)
D)
Fig. 5. Tongue surface shapes behind the constrictions of /s/ and /sh/. A) /s/ of CL, B) /sh/ of CL, C) /s/ of PT1, and D) /s/ of PT2
(From left to right: Sagittal slice, coronal slice at location indicated by yellow line on sagittal slice, and 3-D tongue surfaces)
Fig. 6. Area functions of vocal tract models. a) /s/ in “a souk” and b) /sh/ in “a shell” (red dashed lines indicate the
constriction locations in the oral cavity)
4. DISCUSSION
In PT2, /sh/ is problematic in “ishi”, but not in “asha”. One
explanation lies in the similarity of tongue surface shapes between
/iy/ and /sh/ [21] and the low tongue motility in PT2. The low
tongue motility means reduction in tongue precision. This reduced
precision might make it more difficult to switch between the
similar tongue shapes and positions of /iy/ and /sh/ than the
different tongue shapes and positions of /ah/ and /sh/. Since /s/ has
a very different tongue surface than /iy/, it is easier for the patient
to produce “isi” than “ishi”. So the patient may have defaulted to
the articulation strategy for /s/ to produce /sh/ in “ishi”.
Only three subjects are studied here. There may be
considerable variation in the speech of patients who had similar
surgery procedures [6]. To have a thorough study of fricative
production in post-glossectomy patients, it is necessary to carry out
a more extensive study covering more cases with various tumor
sizes and locations, reconstruction types, and treatments.
Furthermore, studying muscle mechanics after surgery will help us
understand the relationship between surgical procedures and their
resulting speech articulation and acoustics.
10. CONCLUSIONS
This is a preliminary study for analyzing acoustic and articulatory
data of fricatives /s/ and /sh/ for the post-glossectomy patients.
Cine-MR based 3-D vocal tract reconstructions, tongue surface
shapes, and the area function models were obtained and used
effectively to understand the /s/ and /sh/ production and interpret
the observed acoustic spectra, specifically for the pathologic
production in the post glossectomy patients. This approach might
potentially provide guidance on the surgery procedure to improve
the speech outcome of those patients. In future we will study more
subjects and also perform 3-D acoustic analysis considering the
abnormality of the vocal tracts for the patients.
11. ACKNOWLEDGMENT
This research was supported by NIH grants R01 CA133015 and
K99 DC012575
12. REFERENCES
[1] Schröter-Morasch, H., and Ziegler, W. (2005). "Rehabilitation
of impaired speech function (dysarthria, dysglossia)," GMS
Curr Top Otorhinolaryngol Head Neck Surg 4, 1-13.
[2] Dwivedi, R. C., Kazi, R. A., Agrawal, N., Nutting, C. M.,
Clarke, P. M., Kerawala, C. J., Rhys-Evans, P. H., and
Harrington, K. J. (2009). "Evaluation of speech outcomes
following treatment of oral and oropharyngeal cancers,"
Cancer Treat Rev 35, 417-424.
[3] Schuster, M., and Stelzle, F. (2012). "Outcome measurements
after oral cancer treatment: speech and speech-related aspects-an overview," Oral Maxillofac Surg 16, 291-298.
[4] Borggreven, P. A., Verdonck-de Leeuw, I., Langendijk, J. A.,
Doornaert, P., Koster, M. N., de Bree, R., and Leemans, R.
(2005). "Speech outcome after surgical treatment for oral and
oropharyngeal cancer: A longitudinal assessment of patients
reconstructed by a microvascular flap," Head Neck-J Sci Spec
27, 785-793.
[5] Bressmann, T., Ackloo, E., Heng, C.-L., and Irish, J. C.
(2007). "Quantitative three-dimensional ultrasound imaging
of partially resected tongues," Otolaryngology - Head and
Neck Surgery 136, 799-805.
[6] Bressmann, T., Sader, R., Whitehill, T. L., and Samman, N.
(2004). "Consonant intelligibility and tongue motility in
patients with partial glossectomy," J Oral Maxil Surg 62, 298303.
[7] Zhou, X., Stone, M., and Espy-Wilson, C.Y. (2011), “A
comparative acoustic study on speech of glossectomy patients
and normal subjects”, INTERSPEECH , August, Florence,
Italy.
[8] Stone, M., Rizk, S., Woo, J, Murano, EZ., Chen, H., Prince,
JL (2012), “Frequency of apical and laminal /s/ in normal and
post-glossectomy patients”, Journal of Medical Speech
Language Pathology (accepted).
[9] Stevens, K. N. (1998). Acoustic phonetics (MIT Press,
Cambridge, Mass.).
[10] Fant, G. (1970). Acoustic theory of speech production with
calculations based on X-ray studies of Russian articulations
(Mouton, The Hague).
[11] Shadle, C. (1985). “The acoustics of fricative consonants,”
Ph.D. thesis, Department of Electrical Engineering and
Computer Science, Massachusetts Institute of Technology,
released as MIT-RLE Technical Report No. 506.
[12] Badin, P. (1991). "Fricative Consonants - Acoustic and X-Ray
Measurements," J Phonetics 19, 397-408.
[13] Shadle, C.H. (1990) Articulatory-Acoustic Relationships in
Fricative Consonants. Speech Production and Speech
Modelling Kluwer Academic Press, 187-209.
[14] Jongman, A., Wayland, R., and Wong, S. (2000). "Acoustic
characteristics of English fricatives," J Acoust Soc Am 108,
1252-1263.
[15] Narayanan, S. S., Alwan, A. A., and Haker, K. (1995). "An
Articulatory Study of Fricative Consonants Using MagneticResonance-Imaging," J Acoust Soc Am 98, 1325-1347.
[16] Bresch, E., Riggs, D., Goldstein, L., Byrd, D., Lee S.,
Narayanan, S. (2008), “An analysis of vocal tract shaping in
English sibilant fricatives using real-time magnetic resonance
imaging”, Interspeech, p2823-2826.
[17] Iskarous, K., Shadle, C. H., and Proctor, M. I. (2011).
"Articulatory-acoustic kinematics: The production of
American English /s/," J Acoust Soc Am 129, 944-954.
[18] Narayanan, S., and Alwan, A. (2000). "Noise source models
for fricative consonants," IEEE T Speech Audi P. 8, 328-344.
[19] Howe, M. S., and McGowan, R. S. (2005). "Aeroacoustics of
[s]," P Roy Soc a-Math Phy 461, 1005-1028.
[20] Nozaki, K. (2010). "Numerical Simulation of Sibilant [s]
Using the Real Geometry of a Human Vocal Tract," High
Performance Computing on Vector Systems 2010, 137-148.
[21] Stone, M. and Lundberg, A. (1996): “Three-dimensional
tongue surface shapes of English consonants and vowels,” J.
Acoust. Soc. Amer., 99, 3728-3737.
[22] Percival, D. B., and Walden, A. T. (2002). Spectral analysis
for physical applications: multitaper and conventional
univariate techniques (Cambridge University Press,
Cambridge etc.).
[23] Blacklock, O. S. (2004). Characteristics of variation in
production of normal and disordered fricatives, using
reduced-variance spectral methods. Ph.D. thesis, School of
Electronics and Computer Science, University of
Southampton, UK.
[24] Woo, J., Murano, E. Z., Stone, M., Prince , J. L., (2012),
“Reconstruction of high resolution tongue volumes from
MRI”, IEEE Trans on Biomedical Engineering (accepted).
[25] Kitamura, T., Narishige T. (2011), “Development of plug-in
for ImageJ to extract vocal tract area function”, Proceedings
of International Seminar of Speech Production.
[26] Kent, R. D., and Read, C. (2002). The acoustic analysis of
speech (Thomson Learning, Albany, NY).
