Synergy of Acoustic-Phonetics and Peripheral Auditory Modeling Towards Robust Speech Recognition
advertisement
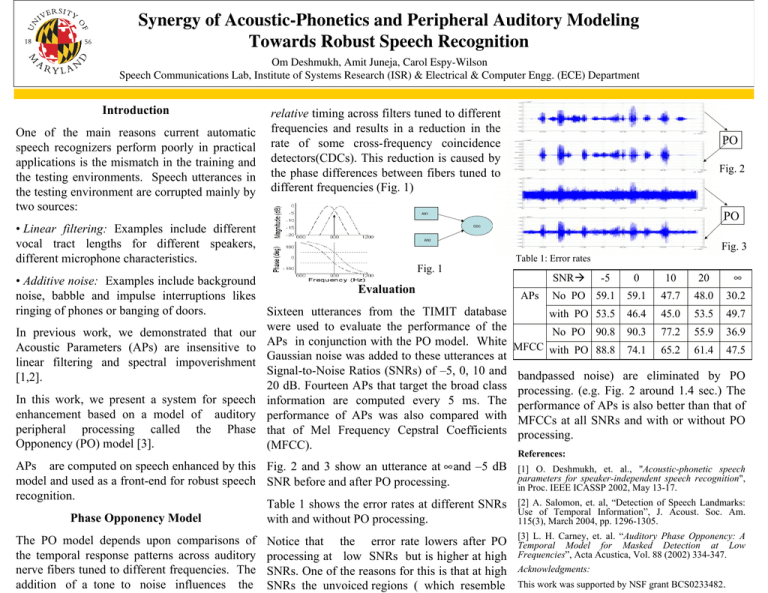
Synergy of Acoustic-Phonetics and Peripheral Auditory Modeling Towards Robust Speech Recognition Om Deshmukh, Amit Juneja, Carol Espy-Wilson Speech Communications Lab, Institute of Systems Research (ISR) & Electrical & Computer Engg. (ECE) Department Introduction One of the main reasons current automatic speech recognizers perform poorly in practical applications is the mismatch in the training and the testing environments. Speech utterances in the testing environment are corrupted mainly by two sources: • Linear filtering: Examples include different vocal tract lengths for different speakers, different microphone characteristics. relative timing across filters tuned to different frequencies and results in a reduction in the rate of some cross-frequency coincidence detectors(CDCs). This reduction is caused by the phase differences between fibers tuned to different frequencies (Fig. 1) Fig. 2 PO AN1 CDC AN2 Fig. 3 Table 1: Error rates Fig. 1 • Additive noise: Examples include background Evaluation noise, babble and impulse interruptions likes ringing of phones or banging of doors. Sixteen utterances from the TIMIT database were used to evaluate the performance of the In previous work, we demonstrated that our APs in conjunction with the PO model. White Acoustic Parameters (APs) are insensitive to Gaussian noise was added to these utterances at linear filtering and spectral impoverishment Signal-to-Noise Ratios (SNRs) of –5, 0, 10 and [1,2]. 20 dB. Fourteen APs that target the broad class In this work, we present a system for speech information are computed every 5 ms. The enhancement based on a model of auditory performance of APs was also compared with peripheral processing called the Phase that of Mel Frequency Cepstral Coefficients Opponency (PO) model [3]. (MFCC). APs are computed on speech enhanced by this Fig. 2 and 3 show an utterance at ∞and –5 dB model and used as a front-end for robust speech SNR before and after PO processing. recognition. Table 1 shows the error rates at different SNRs Phase Opponency Model with and without PO processing. The PO model depends upon comparisons of the temporal response patterns across auditory nerve fibers tuned to different frequencies. The addition of a tone to noise influences the PO Notice that the error rate lowers after PO processing at low SNRs but is higher at high SNRs. One of the reasons for this is that at high SNRs the unvoiced regions ( which resemble 0 10 20 ∞ No PO 59.1 59.1 47.7 48.0 30.2 with PO 53.5 46.4 45.0 53.5 49.7 No PO 90.8 90.3 77.2 55.9 36.9 MFCC with PO 88.8 74.1 65.2 61.4 47.5 SNRÆ APs -5 bandpassed noise) are eliminated by PO processing. (e.g. Fig. 2 around 1.4 sec.) The performance of APs is also better than that of MFCCs at all SNRs and with or without PO processing. References: [1] O. Deshmukh, et. al., "Acoustic-phonetic speech parameters for speaker-independent speech recognition", in Proc. IEEE ICASSP 2002, May 13-17. [2] A. Salomon, et. al, “Detection of Speech Landmarks: Use of Temporal Information”, J. Acoust. Soc. Am. 115(3), March 2004, pp. 1296-1305. [3] L. H. Carney, et. al. “Auditory Phase Opponency: A Temporal Model for Masked Detection at Low Frequencies”, Acta Acustica, Vol. 88 (2002) 334-347. Acknowledgments: This work was supported by NSF grant BCS0233482.
