Document 13359571
advertisement

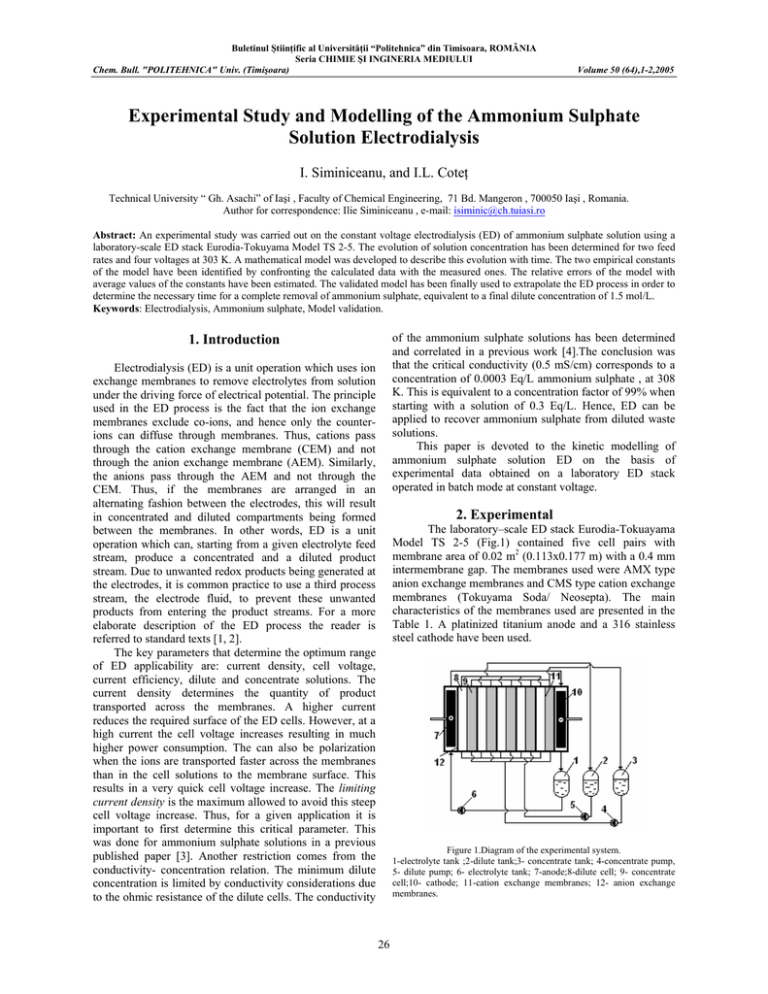
Buletinul Ştiinţific al Universităţii “Politehnica” din Timisoara, ROMÂNIA Seria CHIMIE ŞI INGINERIA MEDIULUI Chem. Bull. "POLITEHNICA" Univ. (Timişoara) Volume 50 (64),1-2,2005 Experimental Study and Modelling of the Ammonium Sulphate Solution Electrodialysis I. Siminiceanu, and I.L. Coteţ Technical University “ Gh. Asachi” of Iaşi , Faculty of Chemical Engineering, 71 Bd. Mangeron , 700050 Iaşi , Romania. Author for correspondence: Ilie Siminiceanu , e-mail: isiminic@ch.tuiasi.ro Abstract: An experimental study was carried out on the constant voltage electrodialysis (ED) of ammonium sulphate solution using a laboratory-scale ED stack Eurodia-Tokuyama Model TS 2-5. The evolution of solution concentration has been determined for two feed rates and four voltages at 303 K. A mathematical model was developed to describe this evolution with time. The two empirical constants of the model have been identified by confronting the calculated data with the measured ones. The relative errors of the model with average values of the constants have been estimated. The validated model has been finally used to extrapolate the ED process in order to determine the necessary time for a complete removal of ammonium sulphate, equivalent to a final dilute concentration of 1.5 mol/L. Keywords: Electrodialysis, Ammonium sulphate, Model validation. of the ammonium sulphate solutions has been determined and correlated in a previous work [4].The conclusion was that the critical conductivity (0.5 mS/cm) corresponds to a concentration of 0.0003 Eq/L ammonium sulphate , at 308 K. This is equivalent to a concentration factor of 99% when starting with a solution of 0.3 Eq/L. Hence, ED can be applied to recover ammonium sulphate from diluted waste solutions. This paper is devoted to the kinetic modelling of ammonium sulphate solution ED on the basis of experimental data obtained on a laboratory ED stack operated in batch mode at constant voltage. 1. Introduction Electrodialysis (ED) is a unit operation which uses ion exchange membranes to remove electrolytes from solution under the driving force of electrical potential. The principle used in the ED process is the fact that the ion exchange membranes exclude co-ions, and hence only the counterions can diffuse through membranes. Thus, cations pass through the cation exchange membrane (CEM) and not through the anion exchange membrane (AEM). Similarly, the anions pass through the AEM and not through the CEM. Thus, if the membranes are arranged in an alternating fashion between the electrodes, this will result in concentrated and diluted compartments being formed between the membranes. In other words, ED is a unit operation which can, starting from a given electrolyte feed stream, produce a concentrated and a diluted product stream. Due to unwanted redox products being generated at the electrodes, it is common practice to use a third process stream, the electrode fluid, to prevent these unwanted products from entering the product streams. For a more elaborate description of the ED process the reader is referred to standard texts [1, 2]. The key parameters that determine the optimum range of ED applicability are: current density, cell voltage, current efficiency, dilute and concentrate solutions. The current density determines the quantity of product transported across the membranes. A higher current reduces the required surface of the ED cells. However, at a high current the cell voltage increases resulting in much higher power consumption. The can also be polarization when the ions are transported faster across the membranes than in the cell solutions to the membrane surface. This results in a very quick cell voltage increase. The limiting current density is the maximum allowed to avoid this steep cell voltage increase. Thus, for a given application it is important to first determine this critical parameter. This was done for ammonium sulphate solutions in a previous published paper [3]. Another restriction comes from the conductivity- concentration relation. The minimum dilute concentration is limited by conductivity considerations due to the ohmic resistance of the dilute cells. The conductivity 2. Experimental The laboratory–scale ED stack Eurodia-Tokuayama Model TS 2-5 (Fig.1) contained five cell pairs with membrane area of 0.02 m2 (0.113x0.177 m) with a 0.4 mm intermembrane gap. The membranes used were AMX type anion exchange membranes and CMS type cation exchange membranes (Tokuyama Soda/ Neosepta). The main characteristics of the membranes used are presented in the Table 1. A platinized titanium anode and a 316 stainless steel cathode have been used. Figure 1.Diagram of the experimental system. 1-electrolyte tank ;2-dilute tank;3- concentrate tank; 4-concentrate pump, 5- dilute pump; 6- electrolyte tank; 7-anode;8-dilute cell; 9- concentrate cell;10- cathode; 11-cation exchange membranes; 12- anion exchange membranes. 26 Chem. Bull. "POLITEHNICA" Univ. (Timişoara) Volume 50 (64),1-2,2005 The removal degree of the ammonium sulphate (X= 1C/C0 ) after 1980 s ( 33 minutes ) at a total flow rate of 100 L/h increased with the voltage from 17.14% at 5 V to 63.79% at 12 V. At a total flow rate of 140 L/h the removal degree increased from 15% to 66.25% in the same conditions. The instantaneous concentrations in diluted and concentrated streams have been indirectly determined by measuring the electric conductivity at 303 K with a WTW LF 196 conductivity meter equipped with a TetraCon 961.5 conductivity cell with an integrated temperature sensor. The epoxy cell had easy to clean graphite plates with a cell constant of 0.609 cm-1, a response time less than 12 seconds. The cell was calibrated with commonly used standard KCl 0.01 M solution having a conductivity of 1.412 μS/cm at 298 K. This 4 electrode cell reduces the problem of polarization error and fouling of the electrodes. The ammonium sulphate solutions of about 1% w have been prepared analytical grade salt and pre water (0.05 μS/cm).The laboratory unit was equipped with inline instruments for monitoring dilute, concentrate and electrode rinse feed rates and tank temperatures; voltage at the power source , across the stack ( including anode and cathode chambers, and across the five cell pairs. Before each experiment the ED unit was thoroughly cleaned to circulate through the unit for five minutes at high flow rates. Table 3. Experimental results at a total flow rate of 140 L/h, and T= 303 K. Time (s) 0 180 360 540 720 900 1080 1260 1440 1620 1800 1980 Table 1. Characteristics of the membranes used. Membrane S, % AMX CMS 98.0 98.0 IEC, Eq/kg R, Ωcm2 1.5 2.2 3.0 2.0 BS, kg/cm2 5.0 3.5 W, g/g dry 0.3 0.4 δ, mm 0.17 0.15 4. Mathematical modelling S- selectivity, IEC- ion exchange capacity, R- electric resistance, BSburst strength, W- water content, δ-membrane thickness. A mathematical model , derived on a phenomenological basis, could allow : (I)to predict the behaviour of the system in similar conditions but a larger scale ( scale-up) ,(II) to calculate the necessary time for a final desired concentration,(III)to evaluate the necessary of electrical energy for a given application. There are several published attemps to modell the ED operated in a batch recirculation mode [5-11]. The model proposed in this paper is established starting from the molar flux of the ions i (NH4+, SO42- ) from the dilute stream through the membrane. This can be expressed in terms of current density as follows[10,11]: dn η dI Ni = − i = c (mol/s), (1) dτ zFdAm 3. Results and discussion The primary experimental results are presented in the Table 2 (total flow rate of 100 L/h, and different constant voltages: 5V; 7.5V; 10V; 12V) , and in the Table 2 ( total flow rate of 140 L/h, and the same voltages). They represent the evolution of the dilute stream concentrations. In each run the solution volume (VD) was 4.56 L, measured with errors from -1.65% to + 1.23%. Table 2. Experimental results at a total flow rate of 100 L/h , and T= 303 K Time, (s) 0 180 360 540 720 900 1080 1260 1440 1620 1800 1980 Diluted solution concentration, (mol/m3) 5V 7.5 V 10 V 12 V 90.8788 90.3106 90.2121 88.6591 89.5100 87.4200 85.7200 83.1250 88.1600 84.5600 81.2600 77.6150 86.8250 81.7300 76.8350 72.1300 85.5000 78.9300 72.4500 66.6800 84.1900 76.1600 68.1050 61.2600 82.9000 73.4250 63.8100 55.8800 81.6200 70.7300 59.5600 50.5500 80.3500 68.0600 55.3750 45.2750 79.1000 65.4400 51.2500 40.0700 77.8700 62.8500 47.1900 34.9400 76.6400 60.3000 43.2150 29.9250 Diluted solution concentration, (mol/m3) 5V 7.5 V 10 V 12 V 91.6061 91.0909 90.7273 89.9015 90.1500 88.0200 86.0900 84.3100 88.7000 84.9900 81.5700 78.7700 87.2500 82.0200 77.1700 73.2900 85.8050 79.0950 72.8900 67.8700 84.3600 76.2200 68.7400 62.5200 82.9150 73.4000 64.7100 57.2600 81.4750 70.6350 60.8300 52.0850 80.0400 67.9250 57.0800 47.0200 78.6000 65.2700 53.4600 42.0700 77.1700 62.6700 49.9850 37.2650 75.7400 60.1250 46.6500 32.6200 Where: Am = membrane area (m2 ), I= current intensity (A), F=Faraday constant ( 96500 C/Eq), τ= time (s), ni = number of moles transferred, ηc = current efficiency . The assumption of constant flux (Ni) and constant current efficiency in dilute cell gives: dI I = = const. (2) dAm Am Concequently, the molar flux at any point of the membrane surface ca be written as follows: ( ) N i = k L Ci − Cis = k L ΔC Cis (3) are the concentrations at the bulk and at Where Ci and the membrane surface, respectively. 27 Chem. Bull. "POLITEHNICA" Univ. (Timişoara) Volume 50 (64),1-2,2005 Due to the very short residence time in the dilute compartment ( about one second in our case ), and the constancy of the the ratio I/Am, ΔCi can be assumed to be constant along the membrane surface. Hence, (1) and (3) can be combined to give : zFAm k L ΔC = α k L ηc = (4) I where α is a constant. To correlate the mass transfer coefficient kL the criterial relation (5) , derrived from limiting current measurements [4,5,6], can be used : 1 h Sh = 8.093 Re0.13 Sc 3 , at 100 < Re > 300 (5) Δl where : h, l = characteristic distances of spacer; Sh, Sc, Re = Sherwood, Schmidt, Reynolds numer respectively. For a given system, from (4) and (5) results: ηc = β QD0.13 (6) where : β is a constant ,and QD is the dilute flow rate. In the constant voltage operation the current I can be replaced by the Ohm’ relation : U I= (7) NRcp Table 5. Relative errors (ε,%) of the model for QD= 140 L/h, and T= 303 K. Time, (s) 0 180 360 540 720 900 1080 1260 1440 1620 1800 1980 Time, (s) 0 180 360 540 720 900 1080 1260 1440 1620 1800 1980 Ci0 ⎞ + b ⎟ dCi (9) Ci ⎝ i 0 ⎠ where a = p/α , and b= q/α are constants. By integrating (9) with the limit conditions: at τ =0 , Ci = Ci0 the relation time vs concentration is obtained: ⎤ Ci0 zFVD ⎡ + b Ci0 − Ci ⎥ τ= ln a (10) ⎢ 0.13 Ci UQD ⎣ ⎦ The constants a and b from (10) have been identified by confronting the equation with the experimental data. The average values of a and b , obtained for each experimental kinetic curve at 303 K, are presented in the Table 4. ∫ dτ = zFVD UQD0.13 ⎛ a ∫ ⎜C ( Voltage, V 7.5 10 0 0 -0.040 -0.441 0.059 -0.300 0.224 -0.241 0.272 -0.234 0.257 -0.339 0.043 -1.305 -0.138 -2.235 -0.494 -2.992 -1.206 -4.995 -2.154 -7.048 -2.751 -9.169 12 0 -0.107 0.425 0.062 -0.319 -0.905 -1.409 -1.805 -2.122 -2.794 -3.748 -5.997 Table 6.Relative errors(ε, %)of the model for QD =140 L/h , and T= 303 K. N= number of cell pairs , Rcp= electrical resistance of a cell pair. Neglicting the membranes resistances, the solution resistance can be expressed , at constant temperature, as a function of concentration: 1 p Rcp = Rsol = = +q (8) λsol ci Combining (2), (6), (7), and (8) the differential equation (9) is obtained : τ 5.0 0 0.069 0.014 -0.043 0.083 0.139 0.315 0.312 0.318 0.510 0.367 0.682 5.0 0.000 -0.087 0.042 0.033 -0.106 -0.097 -0.466 -0.493 -0.724 -0.988 -1.137 -1.459 Voltage , V 7.5 10 0.000 0.000 -0.177 -0.062 0.144 0.081 0.077 0.067 -0.164 0.027 -0.541 -0.240 -0.753 -0.285 -1.424 -0.729 -1.835 -0.779 -2.416 -1.409 -3.384 -1.583 -3.957 -1.900 12 0.000 0.074 -0.073 0.403 0.233 -0.348 0.286 0.290 0.362 0.814 1.353 2.056 ) Table 4. Average values of the constants. Voltage, (V) 5 7.5 10 12 Flow rate, (L/h) 100 140 100 140 100 140 100 140 Constants a b 1.3691 12.4040 5.1985 3.8253 4.6851 1.4613 1.3333 0.6300 0.1650 0.0626 0.0696 0.0987 0.0598 0.1050 0.0969 0.1111 Figure 2. Calculated (lines) versus experimental (symbols) data at QD= 100 L/h , and T=303 K. The concentration corresponding to each experimental point has been recalculated with the model including the constants from the Table 4. A graphical comparison between experimental and comupted concentration is given in Fig. 2 and in Fig.3. The relative errors are summarized in 28 Chem. Bull. "POLITEHNICA" Univ. (Timişoara) Volume 50 (64),1-2,2005 applied voltage ( 5 V, 7.5 V, 10 V, and 12 V).The results have shown , as expected, that at higher voltages the feed ion concentration was depleted more rapidly thus reducing the duration of the process. The influence of the flow rate is important only at higher voltages (10 V, and 12 V in this system). At higher feed rates the residence time of the solution in the cells becomes too short. the Table 5 and the Table 6. The adequacy of the model has been testified in this manner. . A mathematical model has been derived and validated with the experimental data. The application of this model allows to predict the system behaviour in various operation conditions and calculate the necessary time for a successful ED of ammonium sulphate solutions, as well as to calculate the necessary electrical energy. . The model developed in this paper could be applied to commercial ED units (industrial / pilot plants) working in batches with recirculation and controlled potential, which is the usual mode of operation of such equipment when the requirements of treated residual solution are moderated. Figure 3. Calculated (lines) versus experimental (symbols) data, at QD = 140 L/h , and T= 303 K. Acknowledgement.This work was supported by a Erasmus project with the Technical University of Vienna, laboratory of the Professor Anton Friedl References 1. Strathmann H., Electrodialysis and related processes,in Membrane Separation Technology. Principles and Applications (Noble R.D., Stern S.A., Eds), Elesevier, New York, 1995. 2. Baker R.W., Membrane Technology and Applications, 2nd Ed., Wiley, New York, 2004. 3. Siminiceanu I., Coteţ I.L., Rev.Chim.(Bucharest), 2005, 56, 31. 4. Siminiceanu I., Coteţ I.L., Bul.Inst.Polit. Iaşi, Chim.,2005, 50(54), 3-4, 16. Figure 4. Calculated dilute concentrations at QD=100 L/h , and T= 303 K. 5. Kraaijeveld G., Sumberova V., Kuindersma S., Wesselingh H., The Chemical Engineering Journal, 1995, 57, 163. 6. Lee G.E., Moon S.H., Chang Y.K., Yoo I.K., Chang H.N., Journal of Membrane Science, 1998, 145, 53. 7. Demircioglu M., Kabay N., Kurucaovali I., Safak C., Gizli N., Desalination, 2001, 136, 317. 8. Farrell S., Hesketh R.P., Slater C.S., Chemical Engineering Education, 2003, 1, 52. 9. Fidaleo M., Moresi M., Biotechnol.Appl.Biochem., 2004, 40, 123. 10. Gong Y., Wang X.L., Yu L.X., Desalination, 2005, 172, 157. 11. Ortiz J.M., Sotoca J.A., Exposito E., Gallud F., GarciaGarcia V., Montiel V., Aldaz A., Jounal of Membrane Science, 2005, 152, 1. Finally, the validated model was used to simulate the electrodialysis exteded to 15 000 seconds (Fig.4 ) in order to evaluate the necessary time for an almost complete removal of ammonium sulphate from the feed solution. If the residual concentration of the diluted solution is 1.5 mmol/L ( removal of over 98%) the necessary time, at a feed rate of 100 L/h, decreases from 3.9 hours at a voltage of 5 V to only 1.1 hours at a voltage of 12 V. A compromise must be adopted because the necessary electrical energy increases with the voltage. 5. Conclusions . Electrodialysis is a suitable process to recover ammonium sulphate, a valuable fertilizer, from residual diluted solutions. . The experimental results obtained on a laboratoryscale ED unit at 303 K, operated at constant voltage in a batch recirculation mode, revealed the influence of two important parameters: feed rate (100 L/h, and 140 L/h), and 29


