A POSTAL SURVEY OF THE INCIDENCE OF LAMENESS AND CLAW... CATTLE IN THE UK: A PRELIMINARY REPORT
advertisement

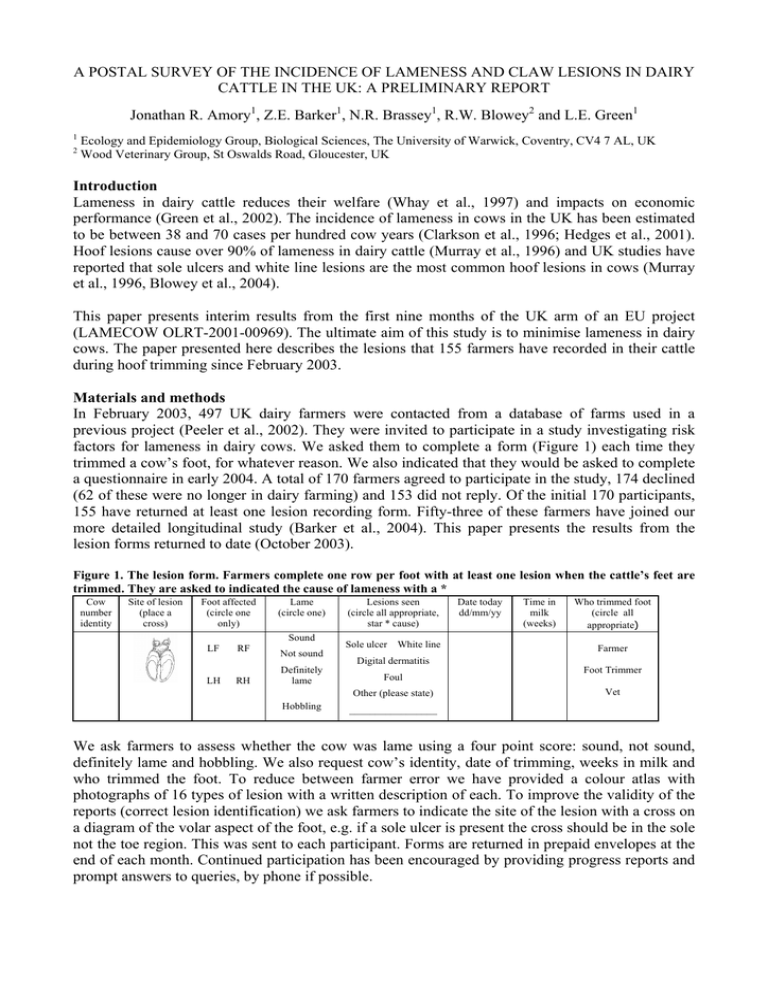
A POSTAL SURVEY OF THE INCIDENCE OF LAMENESS AND CLAW LESIONS IN DAIRY CATTLE IN THE UK: A PRELIMINARY REPORT Jonathan R. Amory1, Z.E. Barker1, N.R. Brassey1, R.W. Blowey2 and L.E. Green1 1 2 Ecology and Epidemiology Group, Biological Sciences, The University of Warwick, Coventry, CV4 7 AL, UK Wood Veterinary Group, St Oswalds Road, Gloucester, UK Introduction Lameness in dairy cattle reduces their welfare (Whay et al., 1997) and impacts on economic performance (Green et al., 2002). The incidence of lameness in cows in the UK has been estimated to be between 38 and 70 cases per hundred cow years (Clarkson et al., 1996; Hedges et al., 2001). Hoof lesions cause over 90% of lameness in dairy cattle (Murray et al., 1996) and UK studies have reported that sole ulcers and white line lesions are the most common hoof lesions in cows (Murray et al., 1996, Blowey et al., 2004). This paper presents interim results from the first nine months of the UK arm of an EU project (LAMECOW OLRT-2001-00969). The ultimate aim of this study is to minimise lameness in dairy cows. The paper presented here describes the lesions that 155 farmers have recorded in their cattle during hoof trimming since February 2003. Materials and methods In February 2003, 497 UK dairy farmers were contacted from a database of farms used in a previous project (Peeler et al., 2002). They were invited to participate in a study investigating risk factors for lameness in dairy cows. We asked them to complete a form (Figure 1) each time they trimmed a cow’s foot, for whatever reason. We also indicated that they would be asked to complete a questionnaire in early 2004. A total of 170 farmers agreed to participate in the study, 174 declined (62 of these were no longer in dairy farming) and 153 did not reply. Of the initial 170 participants, 155 have returned at least one lesion recording form. Fifty-three of these farmers have joined our more detailed longitudinal study (Barker et al., 2004). This paper presents the results from the lesion forms returned to date (October 2003). Figure 1. The lesion form. Farmers complete one row per foot with at least one lesion when the cattle’s feet are trimmed. They are asked to indicated the cause of lameness with a * Cow number identity Site of lesion (place a cross) Foot affected (circle one only) Lame (circle one) Sound LF LH RF RH Not sound Definitely lame Lesions seen (circle all appropriate, star * cause) Sole ulcer White line Time in milk (weeks) Who trimmed foot (circle all appropriate) Farmer Digital dermatitis Foul Other (please state) Hobbling Date today dd/mm/yy Foot Trimmer Vet _________________ We ask farmers to assess whether the cow was lame using a four point score: sound, not sound, definitely lame and hobbling. We also request cow’s identity, date of trimming, weeks in milk and who trimmed the foot. To reduce between farmer error we have provided a colour atlas with photographs of 16 types of lesion with a written description of each. To improve the validity of the reports (correct lesion identification) we ask farmers to indicate the site of the lesion with a cross on a diagram of the volar aspect of the foot, e.g. if a sole ulcer is present the cross should be in the sole not the toe region. This was sent to each participant. Forms are returned in prepaid envelopes at the end of each month. Continued participation has been encouraged by providing progress reports and prompt answers to queries, by phone if possible. Data analysis. The occurrence of lesions is presented as the percentage of each lesion from all records with a lameness score of unsound, definitely lame or hobbling (hereafter called lame cows). The number of farms with no cases and the incidence rate of the four most common lesions; sole ulcer, white line disease, digital dermatitis and foul, are presented for those farms where herd size at the start of the study is known. The distributions of the four most common lesions are presented by month and by weeks in milk. Results Four farms have withdrawn from the study. The herd size of participating farms ranged from 27350 cows (median = 84) at the start of the study. A total of 3623 records had been returned by 24th October 2003, 78% of which were for lame cows. A total of 1711 (56%) cows had a primary lesion identified excluding pre-calved cows. This group have been used for analysis below. Of these 1711 cows, 83% were recorded lame on one date only, 15% were lame twice and 1.5% were lame three or more times. The most common lesions reported were sole ulcer (27%), white line disease (20%), digital dermatitis (16%) and foul (8%) (Figure 2). Incidence data for these lesions is presented in Table 1. 548 412 337 228 166 80 61 52 35 27 23 17 17 13 12 11 4 Fou l For eig n Inte Bod rdig y ital Gro wth He el U lce r Ro tati on Toe Ulc er Ha em /La min itis Toe Ne cro sis San dC Inte rac rdig k ital Der m Ho atit riz. is Wa ll F issu Axi re al W all F issu re Thi ck H ock Oth er 35 30 25 20 15 10 5 0 Sol eU Wh lce ite r line dis eas Dig e ital De rma titis % total lame cases PPP Figure 2. Percent of lesions by form from lame cows, including repeats (n=2043). Number of cases indicated above each bar. Table 1. Incidence rate of the four most common lesions for the 95 farms with identified herd size. Cases/100 cows/Feb-Oct (farms with positive cases only) Lesion No. of farms with no cases Minimum Median Maximum Sole ulcer 19 0.7 4.1 18.6 White line disease 24 0.4 3.7 16.7 Digital dermatitis 44 1.0 4.3 60.8 Foul 46 0.4 2.1 11.3 The most common lesions show a general decrease in incidence from the start of the study onwards (Figure 3), apart from foul, which is less consistent in its pattern of occurrence. Digital dermatitis was at its highest in the two months post-calving. Sole ulcer increased from 13- 24 weeks and white line disease was higher from 17 – 28 weeks in milk (Figure 4). Sole ulcer White line disease st er gu mb Au pte e S Digital dermatitis Time in milk (weeks) Sole ulcer Foul Figure 3. Percent of four most common lesions by calendar month 49-5 2 ly Ju 45-4 8 ne Ju 41-4 4 y Ma 37-4 0 ril Ap 33-3 6 rch Ma 29-3 2 ary bru Fe 0-4 0 25-2 8 5 21-2 4 10 17-2 0 15 13-1 6 20 9-12 25 18 16 14 12 10 8 6 4 2 0 5-8 30 % lesion cases % lesion cases PPPP 35 White line disease Digital dermatitis Foul Figure 4. Percent of lesions by stage of lactation . Discussion To improve quality of data the form was made as clear and simple as possible, with precise definitions of lesions and a colour atlas. There has been a high level of participation in the project, with only four farms knowingly withdrawing from the study. There is a reduction in the proportion of lesions by calendar month from February 2003. This may be because lameness is more common in the winter but may be due to a reduction in responses as the study continues. This is difficult to assess at this point as many farmers only return forms when cows are lame and so whether farms are still recording cannot be determined until the retrospective questionnaire is administered at the end of the recording period. Sole ulcers and foul are at their greatest from three to four months post-calving as reported in other studies (Green et al., 2002; Blowey et al, 2004) and white line disease starts to increase about 4 weeks later. Digital dermatitis was most commonly found in the two months post-calving as reported in Blowey et al., (2004). This gives further credence to the hypothesis that the early lactation cow is either immunosuppressed or more environmentally challenged at this time than at other stages of lactation. Further work These results will be combined with the data from a postal questionnaire that will be sent out in early 2004 that will collect data on the environment and management of these cows. The high variation in lesions and lameness cases between farms suggests that these farms will provide a good sample for further study. References Barker, Z.E., Amory,J.R. Brassey,N.R. Blowey,R.W. and Green, L.E., 2004. Identifying the causes of lameness: On farm data collection methods. Proceedings of the 13th International Symposium on Lameness in Ruminants. Maribor, Slovenia Blowey, R.W., Green, L.E., Collis, V. J. and Packington A.J, 2004. The effects of season and stage of lactation on lameness in 900 dairy cows. Proceedings of the 13th International Symposium on Lameness in Ruminants. Maribor, Slovenia Clarkson, M.J., Downham, D.Y., Faull, W.B., Hughes, J.W., Manson, F.J., Merritt, J.B., Murray, R.D., Russell, W.B., Sutherst, J.E. and Ward, W.R., 1996. Incidence and prevalence of lameness in dairy cattle. Veterinary Record, 138: 663-567. Green, L.E., Hedges, V.J., Schukken, Y.H., Blowey, R.W. and Packington, A.J., 2002. The impact of clinical lameness on the milk yield of dairy cows. Journal of Dairy Science, 85: 2250-2256. Hedges, V.R., Blowey, R.W., Packington, A.J., O’Callaghan, C.J. and Green, L.E., 2001. A longitudinal field trial of the effect of biotin on lameness in dairy cows. J. Dairy Sci., 84: 1969-1975. Murray, R.D., Downham, D.Y., Clarkson, M.J., Faull, W.B., Hughes, J.W., Manson, F.J., Merritt, J.B., Russell, W.B., Sutherst, J.E. and Ward, W.R., 1996. Epidemiology of lameness in dairy cattle: description and analysis of foot lesions. Veterinary Record, 138: 586-591. Peeler, E. J., Green, M. J., Fitzpatrick, J. L., and Green, L.E., 2002. A study of clinical mastitis in British dairy herds with bulk milk somatic cell counts less than 150,000 cells / ml. Veterinary Record, 151: 170-176 Whay, H.R., Waterman, A.E. and Webster, A.J.F., 1997. Associations between locomotion, claw lesions and nociceptive threshold in dairy heifers during the peri-partum period. Veterinary Journal, 154: 155-161.


