scientific correspondence
advertisement
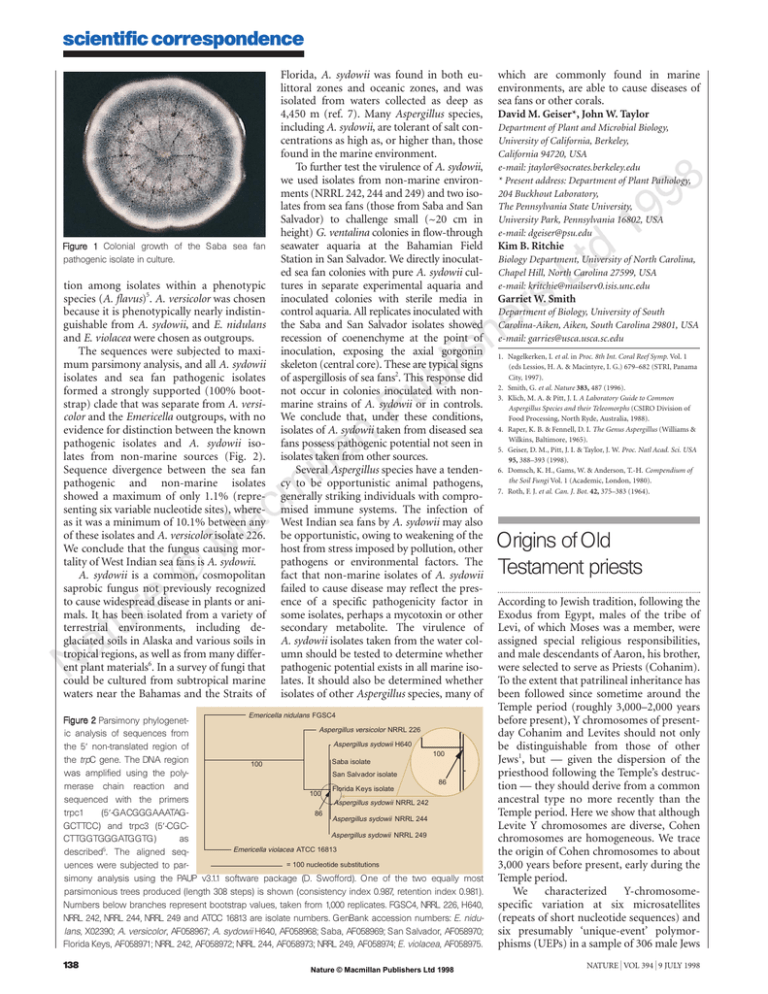
scientific correspondence Figure 1 Colonial growth of the Saba sea fan pathogenic isolate in culture. tion among isolates within a phenotypic species (A. flavus)5. A. versicolor was chosen because it is phenotypically nearly indistinguishable from A. sydowii, and E. nidulans and E. violacea were chosen as outgroups. The sequences were subjected to maximum parsimony analysis, and all A. sydowii isolates and sea fan pathogenic isolates formed a strongly supported (100% bootstrap) clade that was separate from A. versicolor and the Emericella outgroups, with no evidence for distinction between the known pathogenic isolates and A. sydowii isolates from non-marine sources (Fig. 2). Sequence divergence between the sea fan pathogenic and non-marine isolates showed a maximum of only 1.1% (representing six variable nucleotide sites), whereas it was a minimum of 10.1% between any of these isolates and A. versicolor isolate 226. We conclude that the fungus causing mortality of West Indian sea fans is A. sydowii. A. sydowii is a common, cosmopolitan saprobic fungus not previously recognized to cause widespread disease in plants or animals. It has been isolated from a variety of terrestrial environments, including deglaciated soils in Alaska and various soils in tropical regions, as well as from many different plant materials6. In a survey of fungi that could be cultured from subtropical marine waters near the Bahamas and the Straits of Florida, A. sydowii was found in both eulittoral zones and oceanic zones, and was isolated from waters collected as deep as 4,450 m (ref. 7). Many Aspergillus species, including A. sydowii, are tolerant of salt concentrations as high as, or higher than, those found in the marine environment. To further test the virulence of A. sydowii, we used isolates from non-marine environments (NRRL 242, 244 and 249) and two isolates from sea fans (those from Saba and San Salvador) to challenge small (~20 cm in height) G. ventalina colonies in flow-through seawater aquaria at the Bahamian Field Station in San Salvador. We directly inoculated sea fan colonies with pure A. sydowii cultures in separate experimental aquaria and inoculated colonies with sterile media in control aquaria. All replicates inoculated with the Saba and San Salvador isolates showed recession of coenenchyme at the point of inoculation, exposing the axial gorgonin skeleton (central core). These are typical signs of aspergillosis of sea fans2. This response did not occur in colonies inoculated with nonmarine strains of A. sydowii or in controls. We conclude that, under these conditions, isolates of A. sydowii taken from diseased sea fans possess pathogenic potential not seen in isolates taken from other sources. Several Aspergillus species have a tendency to be opportunistic animal pathogens, generally striking individuals with compromised immune systems. The infection of West Indian sea fans by A. sydowii may also be opportunistic, owing to weakening of the host from stress imposed by pollution, other pathogens or environmental factors. The fact that non-marine isolates of A. sydowii failed to cause disease may reflect the presence of a specific pathogenicity factor in some isolates, perhaps a mycotoxin or other secondary metabolite. The virulence of A. sydowii isolates taken from the water column should be tested to determine whether pathogenic potential exists in all marine isolates. It should also be determined whether isolates of other Aspergillus species, many of Emericella nidulans FGSC4 Figure 2 Parsimony phylogenetAspergillus versicolor NRRL 226 ic analysis of sequences from Aspergillus sydowii H640 the 58 non-translated region of 100 the trpC gene. The DNA region Saba isolate 100 was amplified using the polySan Salv ador isolate 86 merase chain reaction and Florida K eys isolate 100 sequenced with the primers Aspergillus sydowii NRRL 242 trpc1 (58-GACGGGAAATAG86 Aspergillus sydowii NRRL 244 GCTTCC) and trpc3 (58-CGCAspergillus sydowii NRRL 249 CTTGGTGGGATGGTG) as 5 Emericella violacea ATCC 16813 described . The aligned seq= 100 nucleotide substitutions uences were subjected to parsimony analysis using the PAUP v3.1.1 software package (D. Swofford). One of the two equally most parsimonious trees produced (length 308 steps) is shown (consistency index 0.987, retention index 0.981). Numbers below branches represent bootstrap values, taken from 1,000 replicates. FGSC4, NRRL 226, H640, NRRL 242, NRRL 244, NRRL 249 and ATCC 16813 are isolate numbers. GenBank accession numbers: E. nidulans, X02390; A. versicolor, AF058967; A. sydowii H640, AF058968; Saba, AF058969; San Salvador, AF058970; Florida Keys, AF058971; NRRL 242, AF058972; NRRL 244, AF058973; NRRL 249, AF058974; E. violacea, AF058975. 138 Nature © Macmillan Publishers Ltd 1998 which are commonly found in marine environments, are able to cause diseases of sea fans or other corals. David M. Geiser*, John W. Taylor Department of Plant and Microbial Biology, University of California, Berkeley, California 94720, USA e-mail: jtaylor@socrates.berkeley.edu * Present address: Department of Plant Pathology, 204 Buckhout Laboratory, The Pennsylvania State University, University Park, Pennsylvania 16802, USA e-mail: dgeiser@psu.edu 8 Kim B. Ritchie Biology Department, University of North Carolina, Chapel Hill, North Carolina 27599, USA e-mail: kritchie@mailserv0.isis.unc.edu Garriet W. Smith Department of Biology, University of South Carolina-Aiken, Aiken, South Carolina 29801, USA e-mail: garries@usca.usca.sc.edu 1. Nagelkerken, I. et al. in Proc. 8th Int. Coral Reef Symp. Vol. 1 (eds Lessios, H. A. & Macintyre, I. G.) 679–682 (STRI, Panama City, 1997). 2. Smith, G. et al. Nature 383, 487 (1996). 3. Klich, M. A. & Pitt, J. I. A Laboratory Guide to Common Aspergillus Species and their Teleomorphs (CSIRO Division of Food Processing, North Ryde, Australia, 1988). 4. Raper, K. B. & Fennell, D. I. The Genus Aspergillus (Williams & Wilkins, Baltimore, 1965). 5. Geiser, D. M., Pitt, J. I. & Taylor, J. W. Proc. Natl Acad. Sci. USA 95, 388–393 (1998). 6. Domsch, K. H., Gams, W. & Anderson, T.-H. Compendium of the Soil Fungi Vol. 1 (Academic, London, 1980). 7. Roth, F. J. et al. Can. J. Bot. 42, 375–383 (1964). Origins of Old Testament priests According to Jewish tradition, following the Exodus from Egypt, males of the tribe of Levi, of which Moses was a member, were assigned special religious responsibilities, and male descendants of Aaron, his brother, were selected to serve as Priests (Cohanim). To the extent that patrilineal inheritance has been followed since sometime around the Temple period (roughly 3,000–2,000 years before present), Y chromosomes of presentday Cohanim and Levites should not only be distinguishable from those of other Jews1, but — given the dispersion of the priesthood following the Temple’s destruction — they should derive from a common ancestral type no more recently than the Temple period. Here we show that although Levite Y chromosomes are diverse, Cohen chromosomes are homogeneous. We trace the origin of Cohen chromosomes to about 3,000 years before present, early during the Temple period. We characterized Y-chromosomespecific variation at six microsatellites (repeats of short nucleotide sequences) and six presumably ‘unique-event’ polymorphisms (UEPs) in a sample of 306 male Jews NATURE | VOL 394 | 9 JULY 1998 scientific correspondence Table 1 Haplotypes classified by UEP groups Haplotype AC N N SC Freq. N AL Freq. N SL Freq. AI N Freq. N SI Freq. N Freq. A NGACCT 207 47 0.959 50 0.877 16 0.302 19 0.679 42 0.618 32 B NGACTT 66 2 0.041 6 0.105 30 0.566 5 0.178 12 0.176 12 0.235 C PAACCT 33 1 0.018 7 0.132 4 0.143 14 0.206 7 0.137 1.000 53 1.000 28 1.000 68 1.000 51 Total 306 h 49 1.000 0.079 57 0.219 0.571 0.487 0.545 0.628 1.000 8 0.532 For each sample, six microsatellites were typed (DYS19, DYS388, DYS390, DYS391, DYS392 and DYS393 (ref. 5)) and repeat counts determined. Y-chromosome haplotypes are listed in UEP groups (A–C) defined by six binary polymorphisms (YAP6, SRY+4064 (ref. 7), sY81 (ref. 8), SRY+465 (T. Shinka and Y. Nakahori, personal communication), 92R7 (ref. 9) and Tat10). Most Cohen chromosomes are included in a single UEP group (A), whereas both Levites and Israelites have a significant number in at least two groups. Within UEP group A, in both the Sephardic and the Ashkenazic Cohanim, a single haplotype, the Cohen modal haplotype, is dominant. The microsatellite scores for this haplotype, in the order of the microsatellite polymorphisms listed, are 14, 16, 23, 10, 11 and 12, according to the nomenclature of ref. 5. UEP groups are named by using references for the binary polymorphisms, in the order they are listed in parentheses above, as follows: P, YAP insert present; N, no YAP insert; A, adenine; C, cytosine; G, guanine; T, thymine. Priestly and lay classifications are: AC, Ashkenazic Cohen; SC, Sephardic Cohen; AL, Ashkenazic Levite; SL, Sephardic Levite; AI, Ashkenazic Israelite; SI, Sephardic Israelite. Ashkenazic: Jewish communities of northern Europe; Sephardic: Jewish communities of North Africa and the Middle East. h is a measure of genetic diversity11. DNA was obtained by taking mouth swabs from 306 males in Israel, Canada and the UK. Before sample collection, prospective donors were questioned to ascertain the geographical origin of their fathers and grandfathers and their priestly/lay status; otherwise, donor selection was random. Some typings for the YAP polymorphism and for DYS19 were first reported elsewhere1. Polymerase chain reaction (PCR) primers for amplification of the microsatellites5 and biallelic markers6–10 were as described, except for SRY+4064, sY81, DYS391 and DYS392, which were redesigned, and 92R7, which was converted to PCR format by M. Hurles and F. Santos in the laboratory of C. Tyler Smith. from Israel, Canada and the United Kingdom. We found 112 compound haplotypes (see Supplementary information). Despite extensive diversity among Israelites, a single haplotype (the Cohen modal haplotype) is strikingly frequent in both Ashkenazic and Sephardic Cohanim (Table 1 and Supplementary information). Because of microsatellite instability, it is useful to define a modal cluster of related chromosomes as the modal haplotype and all of its one-mutation neighbours at the microsatellite loci, which all share the same UEP markers. In the Ashkenazic and Sephardic Cohanim, the modal haplotype (cluster) frequencies are 0.449 (0.694) and 0.561 (0.614), respectively. For comparison, among the Ashkenazic and Sephardic Israelites, the frequencies are 0.132 (0.147) and 0.098 (0.138), respectively. The Levites, unlike the Cohanim, have a significant number of Y chromosomes in three different UEP-defined groups (Table 1), indicating that Levite Y chromosomes have heterogeneous origins. Contemporary Levites, therefore, are not direct patrilineal descendants of a paternally related tribal group. Identification of the frequency of UEP group B chromosomes, and of the Ashkenazic Levite modal haplotype in particular (Supplementary information), in other populations may help in discovering the origins of Levite heterogeneity. For highly polymorphic, single-locus systems, the identification of haplotypes with restricted distributions may provide ‘signatures’ of ancient connections that have been partially obscured by subsequent mixing with other populations. Gene flow from the Cohanim could account for the presence of the Cohen modal haplotype in both Ashkenazic and Sephardic Israelites, or it could be a signature of the ancient Hebrew population. The Cohen modal haplotype may therefore be useful for testing hypotheses regarding the relationship between specific contemporary communities and the ancient Hebrew population. Given the relative isolation of AshNATURE | VOL 394 | 9 JULY 1998 kenazic and Sephardic communities over the past 500 years, the presence of the same modal haplotype in the Cohanim of both communities strongly suggests a common origin. It is interesting, therefore, to estimate the time at which Cohen chromosomes were derived from a common ancestral chromosome (coalescence time). We assume that the modal haplotype is ancestral because of its high frequency, and we exclude from the analysis the few Cohen chromosomes that appear to be unrelated to it because of their membership of different UEP groups (Table 1). The distribution of allele sizes within UEP groups at the trinucleotide microsatellite DYS388 indicates a departure from the stepwise mutation model. Because this model underlies the method we will use to estimate the coalescence time of Cohen chromosomes, we dropped DYS388 from the analysis. Under stepwise mutations, the average squared difference (ASD) in allele size among all current chromosomes and the ancestral haplotype, averaged over loci2,3, has an expectation of mt, where m is the mutation rate and t the coalescence time. Taking the Ashkenazic and Sephardic communities as a whole, the value for ASD is 0.2226. Assuming a mutation rate of 0.0021 (ref. 4), this gives an estimate of 106 generations, which for a generation time of 25 (30) years gives an estimate of 2,650 (3,180) years before present, dating the coalescence of the Cohanim chromosomes to between the Exodus and the destruction of the first Temple in 586 BC. Estimates based on the Ashkenazic and Sephardic samples taken separately are 2,619 (3,142) and 2,684 (3,221) years before present, respectively. To obtain confidence intervals on the distance between the ancestral and sampled chromosomes (ignoring uncertainty in the mutation rate), we note that most nonancestral haplotypes are singletons, indicating that the genealogy connecting Cohen chromosomes is more like the ‘star genealogy’ characteristic of rapid growth than the correlated genealogy characteristic of conNature © Macmillan Publishers Ltd 1998 stant size populations. To obtain confidence intervals in this case, we assume that M mutations occur during the 106 generations, with M being a Poisson random variable with parameter 106 m. The number of mutations increasing allele size (d) is drawn from a binomial distribution with parameters 0.5 and M (0.5 reflects size symmetry of mutations), leading to the distance D4(2d1M)2. In a star genealogy, we have 485 (the number of loci multiplied by the sample size) observations of D. Confidence intervals are obtained by repeating this process 1,000 times and taking the associated 2.5 and 97.5 percentiles, leading to a 95% confidence interval of 84–130 generations for the combined Ashkenazic and Sephardic samples or for a generation time of 25 years, 2,100–3,250 years before present. Under these assumptions, the 95% confidence interval places the origin of priestly Y chromosomes sometime during or shortly before the Temple period in Jewish history. Uncertainty in the mutation rate significantly broadens these intervals (conservatively taking 95% confidence intervals on both the distance and the mutation rate leads to an interval of 34–455 generations) as would a different assumption about the shape of the Cohen Ychromosome genealogy. Mark G. Thomas The Centre for Genetic Anthropology, Departments of Biology and Anthropology, University College London, London WC1E 6BT, UK Karl Skorecki*†, Haim Ben-Ami† * Bruce Rappaport Faculty of Medicine and Research Institute, Technion, Haifa 31096, Israel † Rambam Medical Centre, Haifa 31096, Israel Tudor Parfitt School of Oriental and African Studies, University of London, London WC1H OXG, UK Neil Bradman, David B. Goldstein Department of Zoology, University of Oxford, Oxford OX1 3PS, UK e-mail: david.goldstein@zoo.ox.ac.uk 1. Skorecki, K. et al. Nature 385, 32 (1997). 2. Goldstein, D. B., Linares, A. R., Cavalli-Sforza, L. L. & Feldman, M. W. Genetics 139, 463–471 (1995). 139 scientific correspondence 3. Slatkin, M. A. Genetics 139, 457–462 (1995). 4. Heyer, E., Puymirat, J., Dieltjes, P., Bakker, E. & de Knijff, P. Hum. Mol. Genet. 6, 799–803 (1997). 5. Kayser, M. et al. Int. J. Legal Med. 110, 125–133, 141–149 (1997). 6. Hammer, M. F. Mol. Biol. Evol. 11, 749–761 (1994). 7. Whitfield, L. S., Sulston, J. E. & Goodfellow, P. N. Nature 378, 379–380 (1995). 8. Seielstad, M. T. et al. Hum. Mol. Genet. 3, 2159–2161 (1994). 9. Mathias, N., Bayes, M. & Tyler-Smith, C. Hum. Mol. Genet. 3, 115–123 (1994). 10. Zerjal, T. et al. Am. J. Hum. Genet. 60, 1174–1183 (1997). 11. Nei, M. Molecular Evolutionary Genetics 177 (Columbia Univ. Press, New York, 1987). Supplementary information is available on Nature’s World-Wide Web site (http://www.nature.com) or as paper copy from the London editorial office of Nature. Regeneration in metazoan larvae The capacity for regeneration of lost body parts requiring organogenesis has never been described for metazoan larvae. Here we show for the first time, to our knowledge, the ability of sea star larvae to rapidly and completely regenerate to form fully functional individuals following surgical bisection of the larval body. This capacity leads us to extend the developmental stage at which echinoderm larval cell fates are irreversibly determined. As planktonic larval mortality is thought to be extremely high1, this may be an adaptation to enhance recruitment into adult populations. Larvae of the sea stars Pisaster ochraceus (bipinnaria and brachiolaria) and Luidia foliolata (bipinnaria) that had been surgically bisected across the horizontal larval axis with a scalpel, equidistant between the anterior and posterior poles, regenerated into fully functional larvae over a period of 12–14 days. No mortality occurred in any of the experimental or control larval treatments (n410–12 larvae per treatment). The ontogeny of larval regeneration was similar in both species and is shown for P. ochraceus in Fig. 1. Immediately following surgical manipulation of intact larvae (Fig. 1a), both the anterior and the posterior portions of bipinnaria larvae (hereafter referred to as anterior and posterior larvae; Fig. 1b, c) exhibited swimming behaviours similar to those of control larvae. The posterior larvae consumed food, indicating that these larvae do not lose the ability to capture and ingest food particles, even though the upper portion of the oesophagus and mouth had been surgically removed. By day 3, the anterior larvae had begun to regenerate the surgically separated postoral ciliary bands and to elongate along the larval axis (Fig. 1d). These larvae were able to capture and transport phytoplankton to the region of the former larval mouth. By day 4, the coelom of posterior larvae had elongated and showed signs of fusing above the larval mouth (Fig. 1e). After one week, both anterior and posterior larvae completed the regeneration of the digestive organs and coelom (Fig. 1f, g). At this point in the regenerative process, anterior larvae became able to feed. Capture and ingestion of phytoplankton were observed in culture; guts of anterior larvae contained phytoplankton by day 9 (Fig. 1h). The posterior larvae completely regenerated the pre-oral ciliary bands by day 10 (Fig. 1i). By day 12, most anterior and posterior larvae had regenerated all of their body components (Fig. 1j, k), and surgically bisected bipinnaria larvae of both sea star species were essentially indistinguishable from control larvae by day 14. Successive bisection of a bipinnaria larva of P. ochraceus resulted in complete regeneration indicative of sustained regenerative capacity. Brachiolaria larvae (n412) showed similar chronological and morphological patterns of regeneration. In another study we bisected bipinnaria larvae of L. foliolata that had an adult rudiment (n412). By day 3, rudiment-bearing posterior larvae had undergone complete metamorphosis into juveniles, whereas anterior and control Figure 1 Bipinnaria larvae of P. ochraceus at various stages of regeneration after surgical bisection. The anterior larva is shown in the top row, and the posterior larva in the bottom row. a, Bipinnaria before surgical treatment. b, c, Day 1. Anterior (b) and posterior (c) larvae after surgical division. The gut of the posterior larva is intact enough for feeding. d, Day 3. e, Day 4. Elongation along the larval axis has taken place. f, g, Day 7. The anterior larva (f) has regenerated a functional digestive system. h, Day 9. i, Day 10. Complete regeneration of ciliary bands has occurred in both anterior and posterior larvae. j, k, Day 12. Both larvae have regenerated and are similar to control larvae. cb, ciliary band; cp, coelomic pouch; ds, digestive system; p, phytoplankton. a–e, Scale bar (in a), 200 µm. f–k, Scale bar (in f), 200 µm. 140 Nature © Macmillan Publishers Ltd 1998 larvae required at least three to four times longer to metamorphose into juveniles. Planktonic larvae of sea stars2–4 and brittle stars5 have been shown to reproduce asexually. Although this feature of echinoderm larvae reflects the indeterminate developmental nature of deuterostomal embryonic cells, such observations provide no direct measure of the ability of larvae to regenerate lost body components. Our observations of the ability of sea star larvae to regenerate show that we need to revise ideas about the stages of development of echinoderm larvae at which cell fates are considered to be irreversibly determined6. High estimates of larval mortality are attributed to predation7,8, abiotic factors, such as hydrodynamic shear stress9, or dispersal to inappropriate habitats10. Our results show that at least some larvae are capable of surviving and rapidly regenerating lost body parts following surgical bisection that simulates naturally induced damage. Therefore, population models that include rate functions of larval mortality in the plankton may be using mortality estimates that are unrealistically high. It is also significant that damaged sea star larvae with an adult rudiment rapidly metamorphose to the benthic juvenile phase, thus reducing time spent exposed in the plankton and disproving hypotheses that resorption of the larval body is an energetic prerequisite to successful metamorphosis11. Regenerative capacity may be particularly important in small, abundant, planktotrophic larvae that need to spend long periods of time developing in the plankton12 and which exploit chemical defences less often than large, less abundant, yolk-laden lecithotrophic larvae13,14. 8 Minako S. Vickery, James B. McClintock Department of Biology, University of Alabama at Birmingham, Birmingham, Alabama 35294-1170, USA e-mail: vickerym@uab.edu 1. Young, C. M. & Chia, F. S. in Reproduction of Marine Invertebrates (eds Giese, A. C., Pearse, J. S. & Pearse, V. B.) 385–463 (Boxwood, Pacific Grove, 1987). 2. Bosch, I., Rivkin, R. B. & Alexander, S. P. Nature 337, 169–170 (1989). 3. Rao, P. S., Rao, K. H. & Shyamasundari, K. A. Curr. Sci. 65, 792–793 (1993). 4. Jaeckle, W. B. Biol. Bull. 186, 62–71 (1994). 5. Balser, E. J. Am. Zool. Abstr. 36, 70 (1996). 6. Cameron, R. A., Hough-Evans, B. R., Britten, R. J. & Davidson, E. H. Genes Dev. 1, 75–84 (1987). 7. Morgan, S. G. J. Exp. Mar. Biol. Ecol. 163, 91–110 (1992). 8. Shanks, A. L. in Ecology of Marine Invertebrate Larvae (ed. McEdward, L. R.) 323–368 (CRC, Boca Raton, 1995). 9. Levitan, D. R. in Ecology of Marine Invertebrate Larvae (ed. McEdward, L. R.) 123–156 (CRC, Boca Raton, 1995). 10. Rummill, S. F. Ophelia. 32, 163–198 (1990). 11. Chia, F. S. & Burke, R. B. in Settlement and Metamorphosis of Marine Invertebrate Larvae (eds Chia, F. S. & Rice, M. E.) 212–234 (Elsevier, New York, 1978). 12. Emlet, R. B., McEdward, L. R. & Strathmann, R. R. in Echinoderm Studies II (eds Jangoux, M. & Lawrence, J. M.) 55–136 (Balkema, Rotterdam, 1987). 13. Lindqust, N. & Hay, M. E. Ecol. Monogr. 66, 431–450 (1996). 14. McClintock, J. B. & Baker, B. J. Mar. Ecol. Prog. Ser. 154, 121–131 (1997). NATURE | VOL 394 | 9 JULY 1998


