Asian Journal of Medical Sciences 3(8): 154-157, 2011 ISSN: 2040-8773
advertisement
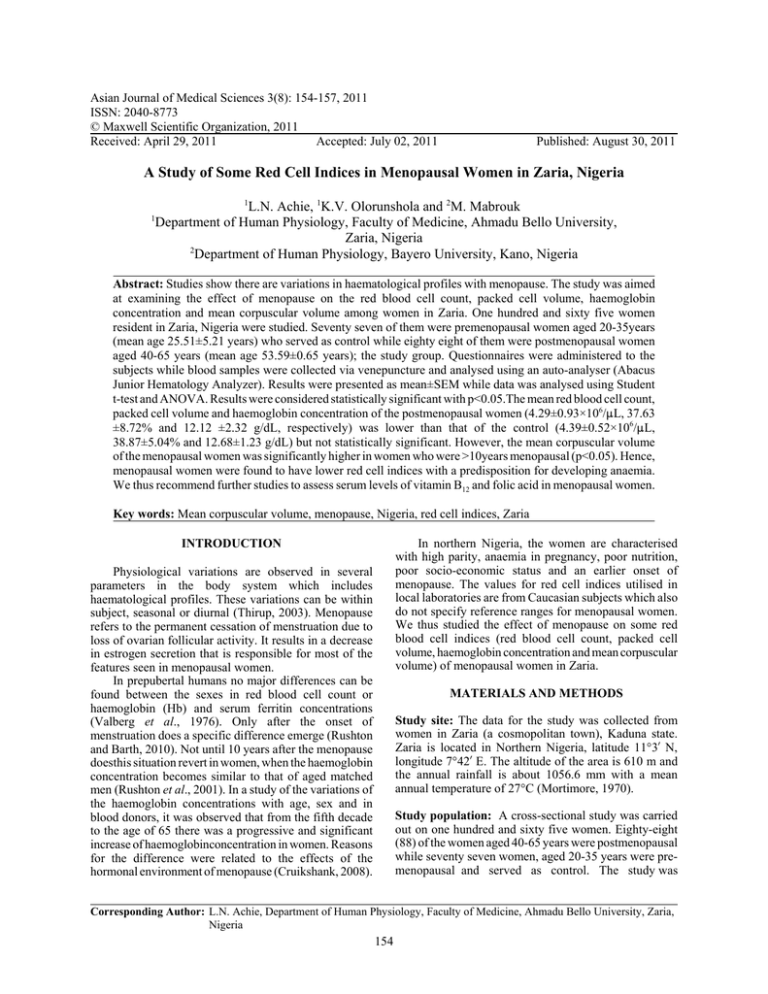
Asian Journal of Medical Sciences 3(8): 154-157, 2011 ISSN: 2040-8773 © Maxwell Scientific Organization, 2011 Received: April 29, 2011 Accepted: July 02, 2011 Published: August 30, 2011 A Study of Some Red Cell Indices in Menopausal Women in Zaria, Nigeria 1 L.N. Achie, 1K.V. Olorunshola and 2M. Mabrouk 1 Department of Human Physiology, Faculty of Medicine, Ahmadu Bello University, Zaria, Nigeria 2 Department of Human Physiology, Bayero University, Kano, Nigeria Abstract: Studies show there are variations in haematological profiles with menopause. The study was aimed at examining the effect of menopause on the red blood cell count, packed cell volume, haemoglobin concentration and mean corpuscular volume among women in Zaria. One hundred and sixty five women resident in Zaria, Nigeria were studied. Seventy seven of them were premenopausal women aged 20-35years (mean age 25.51±5.21 years) who served as control while eighty eight of them were postmenopausal women aged 40-65 years (mean age 53.59±0.65 years); the study group. Questionnaires were administered to the subjects while blood samples were collected via venepuncture and analysed using an auto-analyser (Abacus Junior Hematology Analyzer). Results were presented as mean±SEM while data was analysed using Student t-test and ANOVA. Results were considered statistically significant with p<0.05.The mean red blood cell count, packed cell volume and haemoglobin concentration of the postmenopausal women (4.29±0.93×10⁶/:L, 37.63 ±8.72% and 12.12 ±2.32 g/dL, respectively) was lower than that of the control (4.39±0.52×10⁶/:L, 38.87±5.04% and 12.68±1.23 g/dL) but not statistically significant. However, the mean corpuscular volume of the menopausal women was significantly higher in women who were >10years menopausal (p<0.05). Hence, menopausal women were found to have lower red cell indices with a predisposition for developing anaemia. We thus recommend further studies to assess serum levels of vitamin B12 and folic acid in menopausal women. Key words: Mean corpuscular volume, menopause, Nigeria, red cell indices, Zaria INTRODUCTION In northern Nigeria, the women are characterised with high parity, anaemia in pregnancy, poor nutrition, poor socio-economic status and an earlier onset of menopause. The values for red cell indices utilised in local laboratories are from Caucasian subjects which also do not specify reference ranges for menopausal women. We thus studied the effect of menopause on some red blood cell indices (red blood cell count, packed cell volume, haemoglobin concentration and mean corpuscular volume) of menopausal women in Zaria. Physiological variations are observed in several parameters in the body system which includes haematological profiles. These variations can be within subject, seasonal or diurnal (Thirup, 2003). Menopause refers to the permanent cessation of menstruation due to loss of ovarian follicular activity. It results in a decrease in estrogen secretion that is responsible for most of the features seen in menopausal women. In prepubertal humans no major differences can be found between the sexes in red blood cell count or haemoglobin (Hb) and serum ferritin concentrations (Valberg et al., 1976). Only after the onset of menstruation does a specific difference emerge (Rushton and Barth, 2010). Not until 10 years after the menopause doesthis situation revert in women, when the haemoglobin concentration becomes similar to that of aged matched men (Rushton et al., 2001). In a study of the variations of the haemoglobin concentrations with age, sex and in blood donors, it was observed that from the fifth decade to the age of 65 there was a progressive and significant increase of haemoglobinconcentration in women. Reasons for the difference were related to the effects of the hormonal environment of menopause (Cruikshank, 2008). MATERIALS AND METHODS Study site: The data for the study was collected from women in Zaria (a cosmopolitan town), Kaduna state. Zaria is located in Northern Nigeria, latitude 11°3! N, longitude 7°42! E. The altitude of the area is 610 m and the annual rainfall is about 1056.6 mm with a mean annual temperature of 27°C (Mortimore, 1970). Study population: A cross-sectional study was carried out on one hundred and sixty five women. Eighty-eight (88) of the women aged 40-65 years were postmenopausal while seventy seven women, aged 20-35 years were premenopausal and served as control. The study was Corresponding Author: L.N. Achie, Department of Human Physiology, Faculty of Medicine, Ahmadu Bello University, Zaria, Nigeria 154 Asian J. Med. Sci., 3(8): 154-157, 2011 Table 1: Descriptive statistics of age of control and menopausal women Control Menopausal women Parameters (n = 77) (n = 88) Age (years) 25.51±5 2153.59±6.11 Age at menopause (years) 46.16±3.45 Age at menopause (median) 46.00 Mean±SEM conducted in Zaria within the months of March, 2009 to October, 2010. Selection of the volunteers was based on some inclusion and exclusion criteria. Post menopausal women included in the study group were at least 1 year amenorrhoeic due to a natural cause without a hysterectomy or other procedure that would have stopped their menses (Research on the Menopause, 1981). Women who were diabetics, hypertensive, who smoke cigarette, drink alcohol, with a history of recent blood transfusion or were on medication were excluded from the study. Premenopausal women who were regularly menstruating, non-lactating, non-pregnant with no use of hormonal contraception (at least 1 year) were included in the study. The study was undertaken after obtaining consent from the participants and approval from the Ethical Committee on Human Research of Ahmadu Bello University, Zaria. Table 2: Red blood cell indices for the control and menopausal women Control Red blood cell indices Menopausal women (n = 77) (n = 88) 6 RBC (× 10 /:L) 4.38±0.52 4.29±0.93 HB (g/dL) 12.68±1.23 12.11±2.32 PCV (%) 38.87±5.04 37.63±8.72 RBC-red blood cell count, HB-haemoglobin concentration, PCV-packed cell volume All the parameters were lower in the menopausal women as compared to the control group. However, it was not statistically significant (p>0.05); Mean±SEM menopause for the women was 46.16±3.45 years (Table 1). This value is lower than that for Caucasians (51.4 years) and other studies done in Nigeria; in Yoruba (48.4 years) and Igbo (49.4 years) ethnic groups (Ozumba et al., 2004; Gold et al., 2001 and Okonofua et al., 1990). An earlier age at menopause as observed in the study group is known to be associated with increased morbidity and mortality. The ethnic variations to the menopause experience is said to be due to some variables (parity, menstrual cycle) which differ in the different ethnic groups (Neri et al., 1982). Oestrogen hormone has been implicated as an inhibitor of erythropoiesis (Mirand and Gordon, 1966). A diminished level of this hormone in menopause is associated with increased haemoglobin levels (Bodis et al., 2003). It is also suggested that oestrogen has a possible suppressive effect on erythropoietin induction (Horiguchi et al., 2005). However, our findings indicated there was no increase in red cell indices. There was a decrease in the RBC count, HB and PCV in the menopausal women as compared to control (table 2). These values are contradictory to those of other studies where the values (specifically haemoglobin) were higher in menopausal women (Milman et al., 1992; Castro et al., 1985). However studies by Vázquez et al., (2009) also found no significant difference in the haematocrit (PCV) between premenopausal and postmenopausal women. Other studies indicate that the increase in red cell indices with menopause is usually noticed in women who were at least 10 years postmenopausal (Bain, 2006) but they constituted less than 50% of the menopausal population in this study. The menopausal women were also prone to constitute people of a low socioeconomic group in this study. Some of them were retirees (being older), others were widows and also unemployed. That might have affected their nutrition and could have contributed to the finding of lower RBC count, HB and PCV parameters in the menopausal women (Table 2). This is further corroborated by the higher MCV in women who were >10 years postmenopausal; though within the normal reference range. As supported by a Collection of data: A questionnaire was designed incorporating sociodemographic as well as other relevant history. The questionnaires were self administered while the interviews of the women were conducted in English and the local dialect of Hausa (a lingua franca in this region). Haematological examinations: Blood samples (5 mL) were collected by venepuncture at the cubital fossa, transferred to containers and the samples analysed for the various parameters. Two mL of whole blood was transferred into BD vacutainer bottles which were then used to determine the red cell parameters using a haematology analyzer-Abacus Junior Hematology Analyzer (Diatron, Messtechnik GmbH, Vienna, Austria). At the end of the analysis the results are displayed on a screen ready for printing. The principle of measurement is based on the impedance method. Screening tests: Urinalysis using combi-2 for rapid detection of protein/glucose in urine (Macherey-Nagel, Germany) and HIV screening using Uni-Gold HIV for rapid detection of HIV-1 and HIV-2 antibodies in blood (Trinity Biotech Plc, Bray, Ireland) was carried out. BID rapid malaria pLDH cassette test was used for rapid detection of Plasmodium falciparum, vivax, malariae and ovale in blood (Bundi International Diagnostics Limited, Nigeria) inorder to exclude ineligible subjects. Statistical analysis: Results were presented as mean±SEM while data was analysed using Student t-test and one way analysis of variance (ANOVA). Results were considered statistically significant with p<0.05. RESULTS AND DISCUSSION There was an increase in the MCV with increasing postmenopausal years (p = 0.042). The mean age at 155 Asian J. Med. Sci., 3(8): 154-157, 2011 96 significant. However, the menopausal women had a significantly higher mean corpuscular volume indicating a probable risk for developing anaemia. MCV(fI) 91.83 94 92 MCV(n) 90 RECOMMENDATION 87.64 We recommend studies to assess serum levels of folic acid and vitamin B12 of menopausal women, haematinic supplementation and multi-centre studies in other states of the country incorporating more women. 88 8431 86 84 ACKNOWLEDGMENT 82 We would like to thank Messrs. J.E. Toryila, J. Move and Pastor Yusuf of the Faculty of Medicine for their technical support during the study. 80 78 76 _ <5years 6-10years >10years REFERENCES Fig. 1: Effect of the duration of menopause on the Mean Corpuscular Volume (MCV) Bain, B.J., 2006. Blood Cells: A practical Guide. 4th Edn., Blackwell, Oxford, pp: 177-187. Bodis, J., M. Koppan, K. Garai, K. Zambo and A. Torok, 2003. Estrogen: An instrument or the conductor of the orchestra? Human Reprod., 18(8): 1561-1563. Castro, O.L., T.B. Haddy, S.R. Rana, K.D. Worrell and R.B. Scott, 1985. Electronically determined red blood cell values in a large number of healthy black adults. Subpopulations with low hemoglobin and red blood cell indices. Am. J. Epidemiol., 121(6): 930-936. Chalmers, D.M., A.J. Levi, I. Chanarin, W.R.S. North, and T.W. Meade, 1979. Mean cell volume in a working population: The effects of age, smoking, alcohol and oral contraception. Br. J. Haematol., 43(4): 631-636. Cruikshank, J.M., 2008. Some variations in the normal haemoglobin concentration. Br. J. Haematol., 18(5): 523-530. Gold, E.B., J. Bromberger, S. Crawford, S. Samuels, G.A. Greendale, S.D. Harlow and J. Skurnick, 2001. Factors associated with age at natural menopause in a multiethnic sample of midlife women. Am. J. Epidemiol., 153(9): 865-874. Horiguchi, H., E. Oguma and F. Kayama, 2005. The effects of iron deficiency on estradiol- induced suppression of erythropoietin induction in rats: Implications of pregnancy-related anemia. Blood, 106(1): 67-74. Lewis, S.M., B.J. Bain and I. Bate, 2008. Dacie and Lewis Practical Haematology. 10th Edn., Reed Elsevier India Private Limited, New Delhi, India, pp: 43-193, 595-607. Milman, N., M. Kirchhoff and T. Jorgensen, 1992. Iron status markers, serum ferritin and hemoglobin in 1359 Danish women in relation to menstruation, hormonal contraception, parity, and postmenopausal hormone treatment. Annal. Haematol., 65(2): 96-102. study of elderly Nigerians which revealed that women were more vulnerable to undernutrition than their male counterparts (Olayiwola and Ketiku, 2006). The increase in the mean corpuscular volume of the menopausal women (Fig. 1) is in agreement with the findings of Chalmers et al. (1979) who observed an increase in MCV following the menopause. The MCV is used to classify anaemia according to the size of the red cell. Increased MCV is found in pernicious and megaloblastic anaemia caused by deficiency of vitamin B12 and folic acid. They are essential for the synthesis of DNA. The increase in MCV in this study was statistically significant (p = 0.042) in the >0 years postmenopausal women. Hence a need for age specific reference ranges in this population to ensure efficient detection of abnormal results (Shibata et al., 2005). Evidence from other studies have shown that haematological indices are significantly lower in populations of African origin as compared to standard reference values quoted in the literature for industrialized countries, often applicable to Caucasians (Lewis et al., 2008). This difference could be due to dietary, environmental or genetic factors or a combination of several factors. Some of the factors implicated are a lower dietary intake of nutrients (iron, folates and vitamin B12), chronic blood loss due to parasitic infestation (hookworm) or recurrent plasmodium infection. The differences indicate the need to develop reference values with concurrent developing of strategies to tackle the malnutrition in the postmenopausal population. CONCLUSION The study established that menopause is associated with a decrease in red cell indices which was not 156 Asian J. Med. Sci., 3(8): 154-157, 2011 Rushton, D.H. and J.H. Barth, 2010. What is the evidence for gender differences in ferritin and haemoglobin? Cr. Rev. Oncol. Haematol., 73(1): 1-9. Rushton, D.H., R. Dover, A.W. Sainsbury, M.J. Norris, J.J.H. Gilkes and I.D. Ramsay, 2001. Why should women have lower reference limits for haemoglobin and ferritin concentrations than men? Br. Med. J., 322(7298): 1355-1357. Shibata, T., Y. Ogushi, T. Ogawa and T. Kanno, 2005. Estimation of sex-age specific clinical reference ranges by nonlinear optimization method. Connecting medical informatics and Bio-Informatics: Proceedings of MIE2005 - The XIXth International congress of the European Feder. Med. Inf., 116: 229-234. Thirup, P., 2003. Haematocrit: Within subject and seasonal variation. Sports Med., 33(3): 231 -243. Valberg, L.S., J. Sorbie, J. Ludwig and O. Pelletier, 1976. Serum feritin and the iron status of Canadians. Canad. Med. Associat., 114(5): 417-421. Vázquez, B.Y.S., M.A.S. Vázquez, M. Intaglietta, U. de-Faire, B. Fagrell and P. Cabrales, 2009. Hematocrit and mean arterial blood pressure in preand postmenopause women. Vascular Health Risk Manag., 5: 483-488. Mirand, E.A. and A.S. Gordon, 1966. Mechanism of estrogen action in erythropoeisis. Endocrinol., 78(2): 325-332. Mortimore, M.J., 1970. Zaria and its region: A Nigerian Savannah city and its environs. 14th Annual Conference of the Nigerian Geographical Association. Department of Geography, Ahmadu Bello University, Zaria, Nigeria, pp: 41-54. Neri, A., D. Bider, Y. Lidor and J. Ovadia, 1982. Menopausal age in various ethnic groups in Isreal. Maturitas, 4(4): 341-348. Okonofua, F.E., A. Lawal and J.K. Bamgbose, 1990. Features of menopause and menopausal age in Nigerian women. Int. J. Gynecol. Obstet., 31(4): 341-345. Olayiwola, I.O. and A.O. Ketiku, 2006. Sociodemographic and nutritional assessment of the elderly Yorubas in Nigeria. Asia. Pac. J. Clin. Nutr., 15(1): 95-101. Ozumba, B.C., S.N. Obi, E. Obikili and P. Waboso, 2004. Age, symptoms and perception of menopause among Nigerian women. Obstet. Gynecol. Ind., 54(6): 575-578. Research on the menopause, 1981. Report of a WHO scientific group. World Health Organization Technical Report Series, Geneva, 670: 1-120. 157
![Women's Health at All Ages Menopause.ppt[...]](http://s3.studylib.net/store/data/009081937_1-c188687977d4aa413ffb8558c5e0c10f-300x300.png)
