Document 13326258
advertisement
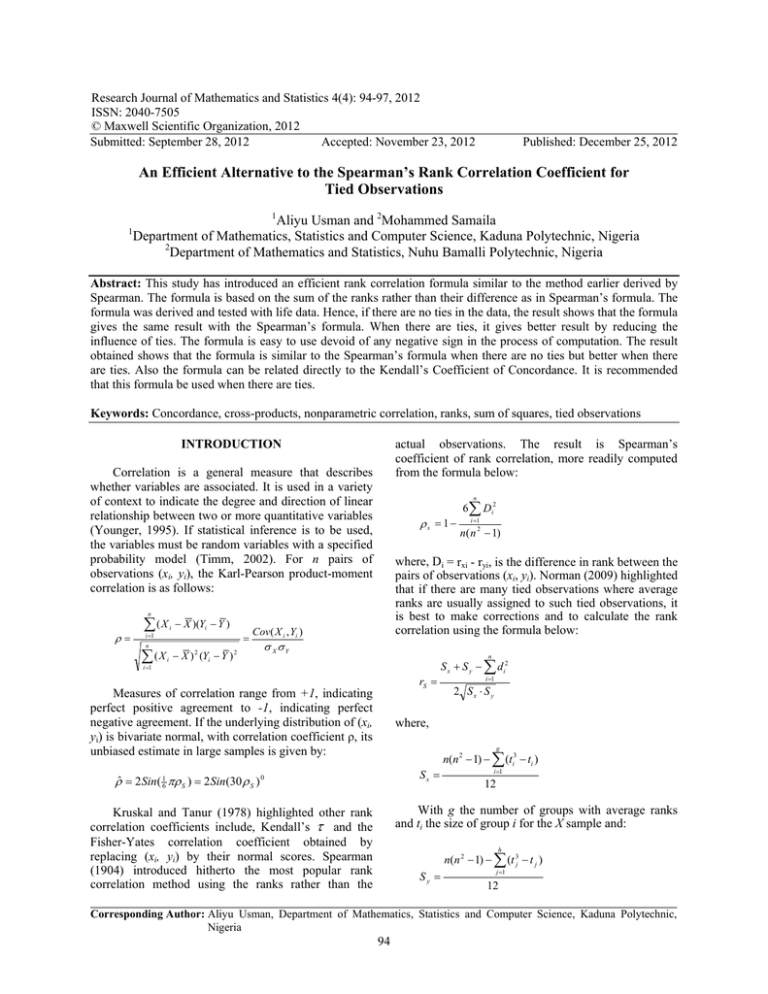
Research Journal of Mathematics and Statistics 4(4): 94-97, 2012 ISSN: 2040-7505 © Maxwell Scientific Organization, 2012 Submitted: September 28, 2012 Accepted: November 23, 2012 Published: December 25, 2012 An Efficient Alternative to the Spearman’s Rank Correlation Coefficient for Tied Observations 1 1 Aliyu Usman and 2Mohammed Samaila Department of Mathematics, Statistics and Computer Science, Kaduna Polytechnic, Nigeria 2 Department of Mathematics and Statistics, Nuhu Bamalli Polytechnic, Nigeria Abstract: This study has introduced an efficient rank correlation formula similar to the method earlier derived by Spearman. The formula is based on the sum of the ranks rather than their difference as in Spearman’s formula. The formula was derived and tested with life data. Hence, if there are no ties in the data, the result shows that the formula gives the same result with the Spearman’s formula. When there are ties, it gives better result by reducing the influence of ties. The formula is easy to use devoid of any negative sign in the process of computation. The result obtained shows that the formula is similar to the Spearman’s formula when there are no ties but better when there are ties. Also the formula can be related directly to the Kendall’s Coefficient of Concordance. It is recommended that this formula be used when there are ties. Keywords: Concordance, cross-products, nonparametric correlation, ranks, sum of squares, tied observations actual observations. The result is Spearman’s coefficient of rank correlation, more readily computed from the formula below: INTRODUCTION Correlation is a general measure that describes whether variables are associated. It is used in a variety of context to indicate the degree and direction of linear relationship between two or more quantitative variables (Younger, 1995). If statistical inference is to be used, the variables must be random variables with a specified probability model (Timm, 2002). For n pairs of observations (xi, yi), the Karl-Pearson product-moment correlation is as follows: n (X i 1 n (X i 1 i i X )(Yi Y ) X ) 2 (Yi Y ) 2 n s 1 6 Di2 i 1 n ( n 2 1) where, Di = rxi - ryi, is the difference in rank between the pairs of observations (xi, yi). Norman (2009) highlighted that if there are many tied observations where average ranks are usually assigned to such tied observations, it is best to make corrections and to calculate the rank correlation using the formula below: Cov( X i , Yi ) XY n rS Measures of correlation range from +1, indicating perfect positive agreement to -1, indicating perfect negative agreement. If the underlying distribution of (xi, yi) is bivariate normal, with correlation coefficient ρ, its unbiased estimate in large samples is given by: S x S y d i2 i 1 2 Sx Sy where, g Sx ˆ 2 Sin ( 16 S ) 2 Sin (30 S ) 0 n(n 2 1) (ti3 ti ) i 1 12 With g the number of groups with average ranks and ti the size of group i for the X sample and: Kruskal and Tanur (1978) highlighted other rank correlation coefficients include, Kendall’s and the Fisher-Yates correlation coefficient obtained by replacing (xi, yi) by their normal scores. Spearman (1904) introduced hitherto the most popular rank correlation method using the ranks rather than the h Sy n(n 2 1) (t 3j t j ) j 1 12 Corresponding Author: Aliyu Usman, Department of Mathematics, Statistics and Computer Science, Kaduna Polytechnic, Nigeria 94 Res. J. Math. Stat., 4(4): 94-97, 2012 With h the number of groups with average ranks and tj the size of group j for the Y sample. If there are no ties, the usual rank correlation formula is used. However, it is mathematically the same to use the formula above untied samples. In that case, the observations are seen as groups of size 1. Meaning that g = h = n and tj = tj =1 for i,j = 1,2,…,n and: Sx Sy In this case Di = rxi - ryi is the difference of the ranks. Instead of using differences between ranks of pairs of X and Y, We may use the sums of the ranks for each pair, where Si = rxi + ryi (Meddis, 1984). To derive the formula, in Eq. (2) the sum of squares and the crossproducts are replaced by their respective ranks (assuming no ties). Thomas (1989) suggested that using the sums of the ranks for each pair is an equivalent of using differences between ranks of pairs of X and Y. Hence, the method for the sums of the ranks goes as follows: n ( n 2 1) 12 The Spearman’s rank correlation coefficient is the most popular nonparametric correlation method but affected by multiple ties. The issue that arises for this study is the need to have a similar but more efficient rank correlation coefficient especially for data with tied observations. Hence, the need for a formula which could give closer value to the product-moment correlation coefficient especially when there are ties. The objective is to emphasize a rank correlation coefficient that neutralizes the influence of ties in the data and gives closer approximation to the productmoment correlation coefficient. The rank correlation coefficient emphasized in this study will particularly neutralize the influence of ties in the data as well as give better results for data with tied observations. n X i 1 i n r 1 2 ... n Xi i 1 n( n 1) 2 (3) Similarly, n n Y r i i 1 Yi i 1 1 2 ... n n(n 1) 2 (4) And n X n rX2i 12 2 2 ... n 2 2 i i 1 i 1 n(n 1)(2n 1) 6 (5) Similarly, METHODOLOGY n Y Recall the Karl-Pearson’s product-moment correlation coefficient given by the formula: n (X i 1 i X )(Yi Y ) n i 1 XY i 1 n n S (r i 1 i 1 Using the computational form of the productmoment correlation coefficient below, we can derive a rank correlation that is efficient even for data with tied observations: i n n i 1 i 1 i 1 n X i Yi X i Y i r (1) n S i 1 2 i n n n i 1 i 1 i 1 rYi ) 2 rX2i rY2i 2 rX i rYi 1 n rX rYi 2 i 1 i (7) r 2 n i 1 2 Xi n rY2i i 1 n n 12 n 1 3 n n X Y r i 1 i i i 1 r X i Yi 1 n 2 n Si 3 n 12n 1 2 i 1 (8) Substituting Eq. (3), (4), (5), (6) and (8) into Eq. (1) we have the following results: n 6 D i2 n ( n 1) r X i Yi i 1 Hence we shall particularly derive; from the product-moment correlation coefficient formula, a rank correlation similar to the Spearman’s method. Whereas Spearman used the difference of the ranks; in this study we shall use the sum of the ranks for another approach to rank correlation formula. Thus the Spearman’s rank correlation has the formula: i 1 2 n( n 1)( 2n 1) 6 (6) From Eq. (5), the following equations are hereby obtained: 2 2 n n n n n X i2 X i n Yi 2 Yi i 1 i 1 i 1 i 1 s 1 Xi i 1 n n n rY2i 12 2 2 ... n 2 From above, it is established that Eq. (1) = (2) and (3) = (4) and n = number of paired observations: Cov ( X i , Yi ) ( X i X ) 2 (Yi Y ) 2 2 i n (2) 95 n n 2 n n2 2 S i n 12n 1 n 1 2 i1 3 4 n n2 2 6 n 12n 1 4 n 1 2 (9) Res. J. Math. Stat., 4(4): 94-97, 2012 n n 2 n2 n 12 3 S i n n 12 n 1 6 i 1 4 2 n2 n 12n 1 n n 12 6 4 Using the method derived by this study the following results were obtained: (10) n n Simplifying Eq. (10) will give the following equation: n 2 2n 3 S i2 n n 12n 1 3n 2 n 1 i 1 n 2 2n 2 n 12n 1 3n 2 n 1 (11) n 2 2 3 Si2 n n 12n 1 3n n 1 i 1 2 2n n 12n 1 3n n 1 (12) n 1 7n 5 6(11094) 7(20) 5 0.7098 n 1 20(20 2 1) 20 1 n s 1 2 n n 12 2n 1 3 n 1 i 1 2 nn Hence, when there are no ties, both formulae will always produce the same results. Similarly Table 2 shows a similar data set from another set of a random sample of 20 fresh Statistics students. When there are ties, we shall demonstrate the superiority of the method introduced in this study as follows: 6 Si2 2n n 12n 1 3n n 1 i 1 6 S i2 6 Di2 i 1 n(n 2 1) 1 6(989) 0.2564 20( 20 2 1) Using the method derived by this study the following result is obtained: (13) n 6 Si2 n n 12 2n 1 3 n 1 i 1 n n 1n 1 Table 1: Rank correlation without ties S No X Y rxi ryi Di 1 49 64 6 8 -2 2 52 66 8 10 -2 3 40 44 1 2 -1 4 58 53 10 6 4 5 69 70 16 14 2 6 68 76 15 19 -4 7 46 74 4 17 -13 8 67 67 14 11 3 9 51 51 7 4 3 10 75 77 19 20 -1 11 90 75 20 18 2 12 60 68 12 12 0 13 59 52 11 5 6 14 41 50 2 3 -1 15 53 42 9 1 8 16 63 69 13 13 0 17 48 54 5 7 -2 18 45 65 3 9 -6 19 72 71 17 15 2 20 73 73 18 16 2 Total (14) n 6 S i2 n n 17 n 5 i 1 n n 1n 1 (15) Finally, separating the fraction in Eq. (15) gives us the desired rank correlation formula in Eq. (16) as follows: n n 6 S i2 i 1 n ( n 2 1) 7n 5 n 1 (16) In this case Si = rxi + ryi is the difference of the ranks. The formula essentially gives the same result as the Spearman’s formula when there are no ties in the data and better result for data with tied observations. Table 2: Rank correlation with ties S No X Y ryi rxi 1 68 90 18 20 2 58 60 10.5 13 3 44 59 1 12 4 51 40 3.5 1 5 66 53 16.5 7.5 6 46 63 2 14 7 52 48 5 5 8 60 45 12 3 9 65 72 15 16.5 10 72 73 20 18 11 64 41 14 2 12 57 69 8.5 15 13 66 54 16.5 9.5 14 57 84 8.5 19 15 61 58 13 11 16 58 53 10.5 7.5 17 56 72 7 16.5 18 51 46 3.5 4 19 70 54 19 9.5 20 55 49 6 6 Total RESULTS The three correlation formulae were used on 800 simulated sets of bivariate data all with tied observations. In all the 800 data sets, this formula gives values closer to the product-moment correlation coefficient. Table 1 shows the percentage scores, in Mathematics (X) and Statistics (Y), obtained from a random sample of 20 fresh Statistics students in 2006. When there are no ties, we shall demonstrate the equality of both formulae. Using the Spearman’s formula the following results were obtained: n s 1 6 D i2 i 1 n ( n 2 1) 1 6 (386 ) 0 .7098 20 ( 20 2 1) 96 Di -2 -2.5 -11 2.5 9 -12 0 9 -1.5 2 12 -6.5 7 -10.5 2 3 -9.5 -0.5 9.5 0 Di2 4 4 1 16 4 16 169 9 9 1 4 0 36 1 64 0 4 36 4 4 386 Di2 4 6.25 121 6.25 81 144 0 81 2.25 4 144 42.25 49 110.25 4 9 90.25 0.250 90.25 0 989 Si 14 18 3 16 30 34 21 25 11 39 38 24 16 5 10 26 12 12 32 34 Si 38 23.5 13 4.5 24 16 10 15 31.5 38 16 23.5 26 27.5 24 18 23.5 7.50 28.5 12 Si2 196 324 9 256 900 1156 441 625 121 1521 1444 576 256 25 100 676 144 144 1024 1156 11094 Si2 1444 552.25 169 20.25 576 256 100 225 992.25 1444 256 552.25 676 756.25 576 324 552.25 56.250 812.25 144 10484 Res. J. Math. Stat., 4(4): 94-97, 2012 W 12 ( S 1) n 6 S i2 7n 5 6(10484 ) 7( 20) 5 s 0.2511 n 1 20 1 n n 1 20( 20 2 1) i 1 2 This formula is yet another improvement in nonparametric correlation analysis. It has both neutralizes the influence of ties as well as provides a closer approximation to the parametric Karl-Pearson’s product-moment correlation coefficient. In addition, the rank correlation coefficient formula has a direct relationship with the Kendall’s coefficient of concordance. It is therefore recommended that researchers and users alike should adopt this formula to use in various areas of nonparametric correlation analysis. This formula could be used as an alternative nonparametric correlation method whenever there are ties. Using the parametric formula, the Pearson’s product-moment method, the following results were obtained: n n n i 1 i 1 i 1 n X i Yi X i Yi 2 2 n n n n n X i2 X i n Yi 2 Yi i 1 i 1 i 1 i 1 20 (70138 ) 1177 (1183 ) 20(70407 ) (1177 ) 20(73605 ) (1183 ) 2 2 0.2548 REFERENCES Similar results patterns were obtained for all the 800 data sets. That is, for data with tied observations, this formula gives closer values to the product-moment correlation coefficient. Kendall, M.G., 1970. Rank Correlation Method. 4th Edn., London, Griffin. Kruskal, W.H. and J.M. Tanur, 1978. International Encyclopedia of Statistics. Collier Macmillan, London. Meddis, R., 1984. Statistics Using Ranks: A Unified Approach. Basil Blackwell, Oxford. Norman, C., 2009. Analyzing Multivariate Data. 4th Edn., Academic Press, New York. Thomas, G.E., 1989. A note on correcting for ties with Spearman's rho. J. Stat. Comput. Simul., 31: 37-40. Timm, N.H., 2002. Applied Multivariate Analysis. Springer, New York. Younger, M.S., 1995. A First Course in Linear Regression. 2nd Edn., Duxbury, Boston. CONCLUSION From the results, it was established that the modified rank correlation coefficient by this study gives the same result with the Spearman’s rank correlation coefficient when there are no ties. In case of tied data, it gives a closer approximation to the parametric KarlPearson’s product-moment correlation coefficient. Furthermore, the introduced method could be related directly to the coefficient of concordance suggested by Kendall (1970), for more than two groups of ranks denoted by W. Hence, the following relation: 97
