ImageJ Hints and Tips Mike Downey January 2011 Obtaining Help
advertisement

ImageJ Hints and Tips
Mike Downey
January 2011
Obtaining Help
Information on writing macros is available from the ImageJ website at
http://rsbweb.nih.gov/ij/developer/macro/macros.html
One of the most useful resources is the description of the built-in functions at
http://imagej.nih.gov/ij/developer/macro/functions.html
which is also available by clicking on 'Help→Macro Functions' from within ImageJ or Fiji.
Drawing
ImageJ has some simple drawing commands built in – plotting and filling lines and shapes. All drawing
commands will use the current colours which may be viewed by opening the Colour Picker (by double-clicking on
the 'dropper' icon in the ImageJ window, or selecting 'Image→Color→Color Picker'. The colours can also be
changed using the 'setColor()' macro command.
ROIs
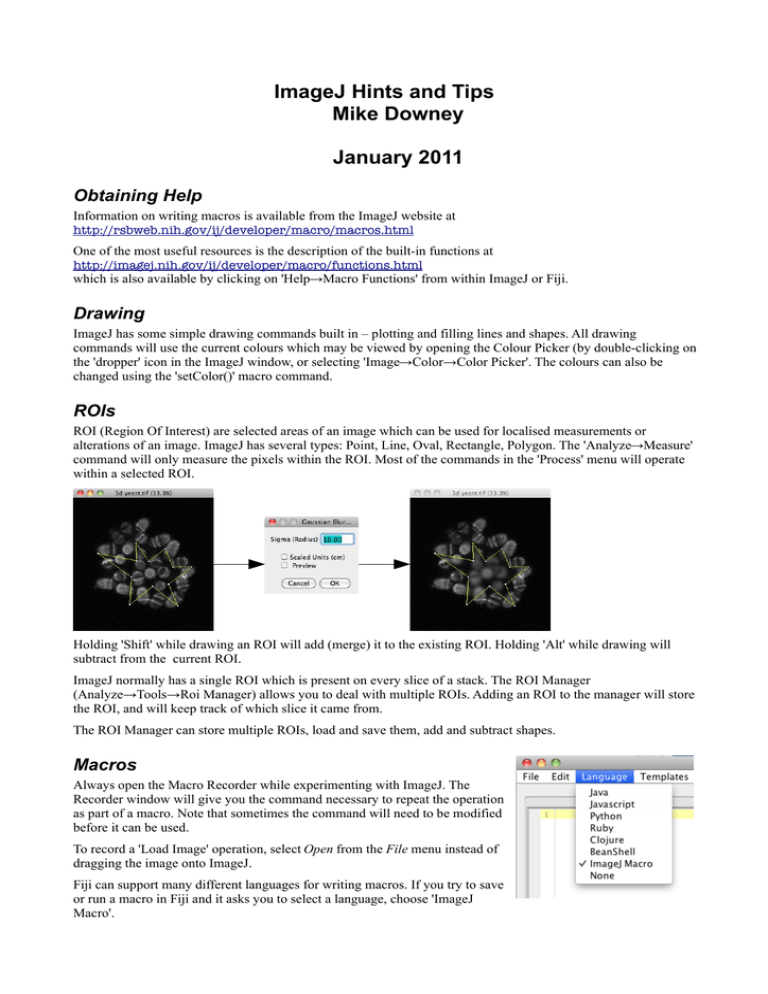
ROI (Region Of Interest) are selected areas of an image which can be used for localised measurements or
alterations of an image. ImageJ has several types: Point, Line, Oval, Rectangle, Polygon. The 'Analyze→Measure'
command will only measure the pixels within the ROI. Most of the commands in the 'Process' menu will operate
within a selected ROI.
Holding 'Shift' while drawing an ROI will add (merge) it to the existing ROI. Holding 'Alt' while drawing will
subtract from the current ROI.
ImageJ normally has a single ROI which is present on every slice of a stack. The ROI Manager
(Analyze→Tools→Roi Manager) allows you to deal with multiple ROIs. Adding an ROI to the manager will store
the ROI, and will keep track of which slice it came from.
The ROI Manager can store multiple ROIs, load and save them, add and subtract shapes.
Macros
Always open the Macro Recorder while experimenting with ImageJ. The
Recorder window will give you the command necessary to repeat the operation
as part of a macro. Note that sometimes the command will need to be modified
before it can be used.
To record a 'Load Image' operation, select Open from the File menu instead of
dragging the image onto ImageJ.
Fiji can support many different languages for writing macros. If you try to save
or run a macro in Fiji and it asks you to select a language, choose 'ImageJ
Macro'.
Variables in ImageJ:
Variables allow the programmer to store text or numbers. Variable names must begin with a letter but they can
contain letters, numbers or underlines (no spaces are allowed in variable names). Text can be a single 'character'
(e.g. letter, number or punctuation) or a series of characters (string) and must be within inverted commas.
Standard mathematical operators can be used with numbers: + - * /
Addition (+) can be used with strings to join (concatenate) them together. Adding a number to a string will convert
the number into text before adding them together.
To put a variable in the middle of a string, you need to build the string up from separate elements, eg.
count = 100;
print(“There are “ + count + “ objects.”);
Output:
Not:
There are 100 objects.
count = 100;
print(“There are count objects.”);
Output:
There are count objects.
The only exception to this rule is passing values to a plugin, e.g.
run("Multiply...", "value="+number);
is the same as
run("Multiply...", "value=&number");
where the ampersand (&) indicates that a variable name follows.
Built-in Variables
ImageJ has some built-in variables:
nSlices
Holds the number of slices in the current image stack.
nImages
How many images are currently open
Flow Control
Macros don't just repeat commands – the macro language can also react to conditions.
a==b
True if a and b are equal.
a>b or a>=b
True if a is greater than b (>= for greater than or equal to)
a<b or a<=b
True if a is less than b (<= for less than or equal to)
a!=b
True if a and b are not equal.
The most common flow control commands are if/else and for. These control whether blocks of code (between
'curly brackets' { }) run or not. The 'if' command takes a condition which is usually comparing one value to
another. If the condition is true, the first block will run. Optionally, a 2nd block can be put after an else command
which will be run if the condition is false (see example below).
The for command has the form:
for( initialisation ; condition ; change ){
commands to execute;
}
The initialisation section sets up the variable which is used in the loop. The condition is checked at the start of
every loop – the contents of the block will only be executed if the condition is true. The 'change' command is
executed at the end of every loop – this usually increases or decreases the 'loop variable'.
Note: i++; is a shorthand for i=i+1;
There are also while and do...while loops (example from the ImageJ website):
while (condition) {
statement(s)
}
do {
statement(s)
} while (condition);
i = 0;
while (i<=90) {
print(i);
i = i + 10;
}
i = 0;
do {
print(i);
i = i + 10;
}while (i<=90);
Common problems with macros:
Spaces in image titles: When a macro command contains image titles, it is sometimes necessary to put the title in
[square brackets], e.g the following command calls the 'Calculator Plus' function which allows images to be added
together.
run("Calculator Plus", "i1=[Result of 3d yeast.tif] i2=[AVG_3d yeast.tif] operation=[Add: i2 = (i1+i2) x
k1 + k2] k1=1 k2=0 create");
This is the same as:
image1="Result of 3d yeast.tif";
image2="AVG_3d yeast.tif";
run("Calculator Plus", "i1=&image1 i2=&image2 operation=[Add: i2 = (i1+i2) x k1 + k2] k1=1 k2=0
create");
Warning: Do not miss out the & (ampersand) symbol. If there are images called 'image1' and 'image2', the
following command will add those images together and not the images given by the variables.
run("Calculator Plus", "i1=image1 i2=image2 operation=[Add: i2 = (i1+i2) x k1 + k2] k1=1 k2=0
create");
Working on the wrong image: If multiple image windows are open, most macro commands will operate on the
'topmost' image (unless the command specifies image titles, such as the example above). Use the selectWindow()
or SelectImage() commands to make sure the correct window is selected.
Confusing comparison with assignment: The single equals (a=b) is used to store a value in a variable. The
double equals (==) checks for equality between two values.
Some ImageJ Idiosyncrasies
Getting results from functions:
When calling a built-in function, most of the time you pass data to the function using variables, numbers or
strings. There are a couple of exceptions to this rule – the getStatistics and getRawStatistics functions. These
functions take variable names and fill the variable with the results.
e.g. normal behaviour where a function returns a value:
width = getWidth();
height = getHeight();
Normal behaviour when passing a variable to a function:
drawOval(width/4 , height/4, width/2, height/2);
Behaviour of the getStatistics function:
getStatistics(area, mean, min, max, std, histogram);
The variables passed to getStatistics will have their contents replaced by the area, mean, minimum and maximum
intensities, standard deviation finally and an array holding the histogram values. The variables do not need to exist
already, they will be created by the method.
Inverting Images:
There are some instances, such as using the Binary or Threshold commands, where a B&W image is returned
where 0=white and 255=black. This is opposite to normal behaviour and can cause problem when using the
Particle Analyzer. If this happens, the phrase (inverting LUT) will be displayed in the information bar in the image
window. To get the image back to normal, select: Image→Lookup Tables→Invert LUT, followed by Edit→Invert.
In a macro, this can be tested for using is("Inverting LUT").
Editing a FFT Spectrum:
The Power Spectrum is obtained by Process→FFT→FFT. Drawing on the spectrum in BLACK (pixel
intensity=0) will indicate which areas of the spectrum are to be ignored when the operation is reversed using
Process→FFT→Inverse FFT. Drawing in WHITE (pixel intensity=255) indicates which areas are to be used in the
inverse and all other areas are ignored. Note: You are not actually drawing or editing the power spectrum and any
other pixel intensities will be ignored. The original spectrum may be obtained by clicking on
Process→FFT→Redisplay Power Spectrum.
Good Programming Practice
Add plenty of comments to macros, by starting a line with //, e.g.
// Macro to resize an image
// Get half the current image size
x=getWidth()/2;
y=getHeight()/2;
// Resize the image
run("Size...", "width=&x height=&y interpolation=Bilinear");
Use sensible variable names. This might not matter with short macros (such as the one above) but in a
complicated macro with many variables, it will be easier to follow (and debug) if the names reflect the purpose of
the variable.
Using Curly Brackets. The curly brackets {} make a block of code appear as if it was a single line. It is a good
idea to always use the brackets in an if command even if you are only controlling a single line of code, e.g.
a=5;
b=5;
if(a==b)
print("true");
else
print("false");
a=5;
b=5;
if(a==b){
print("true");
else
}
{
print("false");
}
The 2nd version is preferable. If you need to add extra lines, you don't need to remember to add the brackets
because they are already there.
ImageJ Menu Commands
Some useful stack operations for 3D Z-Stacks and Time Series stacks.
Z-Project (Image → Stacks → Z-Project)
Takes a stack and returns a single image with the results of the selected Projection Type. Maximum and Average
Intensity are probably the most useful.
Z-Axis Profile (Image → Stacks → Plot Z Axis Profile)
Plots how the intensity varies through the stack. Uses the whole image or an ROI (point or area ROIs only). Like
the normal '2D' plot profile function, click 'List' to get the list of intensity values. Clicking on 'Copy' copies the
numbers to the clipboard so they can be pasted into e.g. the Curve Fitting window or Excel etc.
Curve Fitting (Analyze → Tools → Curve Fitting)
Can be used to fit straight line, polynomial, gaussian, exponential etc. curves to data points. Very useful, not just
for image analysis but for any line fitting jobs. Simply paste in the range of values from a plot profile, choose the
curve type, and click 'Fit'. Selecting 'Show Settings' allows you to change the default values which might be
needed to obtain a good fit.
Reslice (Image → Stacks → Reslice)
Takes a line or rectangle selection and returns an image which would be obtained if the original stack was sliced
vertically along the selection. If a rectangular area is selected, a stack will be returned where each slice in the
stack is a vertical slice through one row of the rectangle. WARNING: Running this without a selection will take
the entire frame as the ROI which can be slow and use a lot of memory.
Other Useful Functions:
Set Scale (Analyze → Set Scale)
Sets the image scale (eg, pixels per micron).
Time Stamper (Image → Stack → Time Stamper)
Add a time 'stamp' to each frame. Choose the time interval between frames, position and font size. Draws the text
in the current selected colour.
Scale Bar (Analyze → Tools → Scale Bar)
Add a scale bar to the image, using the information from 'Set Scale'.
ImageJ Menu Layout
Some of the menu items are in different places in Fiji and 'normal' ImageJ. The most-common commands are
found in the following menus:
• File
◦ All the Load & Save commands are here
• Edit
◦ Copy & Paste commands
◦ Modify Selections (resize, rotate)
◦ Programme Options
• Image
◦ Image Type (8 bit, 16 bit, colour)
◦ Brightness/Contrast/Threshold adjustment
◦ Colour commands (merge/split channels, 'Color Picker')
◦ Stack Commands (including Z-Project, Reslice, Montage, Time Stamper)
• Process
◦ Image processing filters (including FFT
◦ Image Maths & Image Calculator
◦ Background Subtraction
•
•
Analyze
◦ Measure size/shape/intensity of ROI or Image.
◦ Set image scale
◦ Obtain Histogram
◦ Tools sub-menu:
▪ ROI Manager
▪ Curve Fitter
▪ Add Scale Bar
Plugins
◦ Macros → Record Macro (One of the most important menu options. After recording operations, click
on 'Create' to create a new macro to repeat the commands.)
◦ New → Macro (opens a window for writing a new macro)
Macro Commands which are not available from the menu
There are macro commands available which perform tasks which are not available from the menu, or perform
tasks in a different way. A lot of these differences are in the 'get...' commands which obtain the same information
as the 'Measurements' window.
getStatistics(area, mean, min, max, std, histogram)
Fills the area, mean, min, max & std variables with the appropriate calculated values. The histogram variable is an
array which holds the pixel counts used in the histogram window.
getSelectionBounds(x, y, width, height)
Fills the x, y, width & height variables with the position and size of a box which completely encloses the current
ROI.


