Document 13310571
advertisement
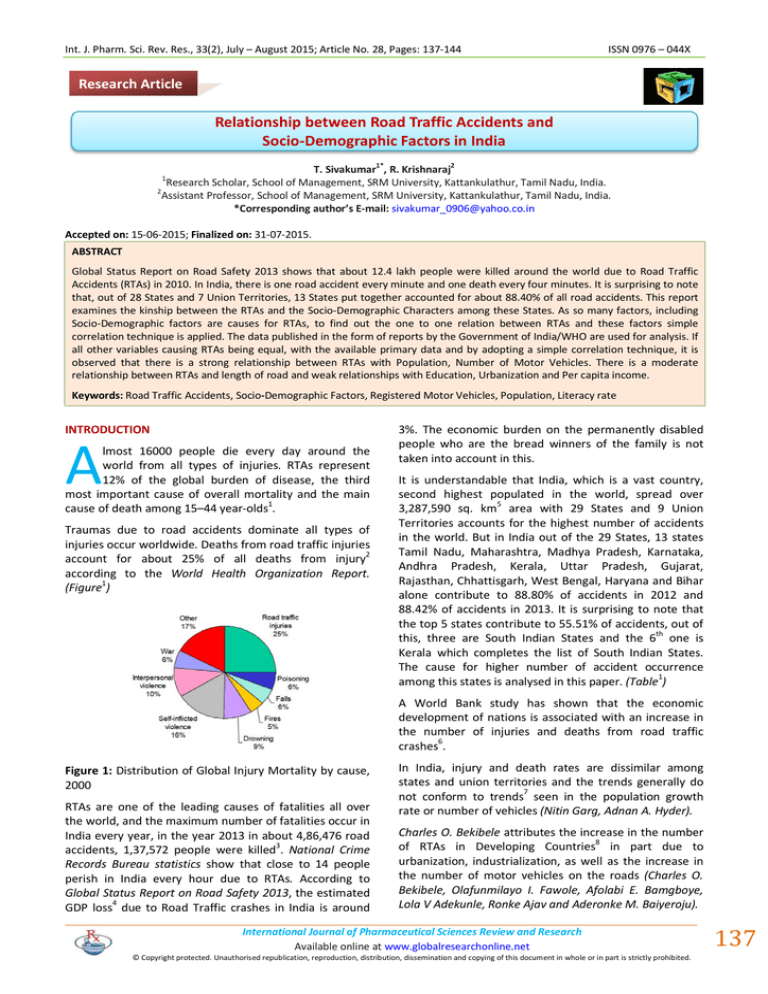
Int. J. Pharm. Sci. Rev. Res., 33(2), July – August 2015; Article No. 28, Pages: 137-144 ISSN 0976 – 044X Research Article Relationship between Road Traffic Accidents and Socio-Demographic Factors in India 1* 2 T. Sivakumar , R. Krishnaraj Research Scholar, School of Management, SRM University, Kattankulathur, Tamil Nadu, India. 2 Assistant Professor, School of Management, SRM University, Kattankulathur, Tamil Nadu, India. *Corresponding author’s E-mail: sivakumar_0906@yahoo.co.in 1 Accepted on: 15-06-2015; Finalized on: 31-07-2015. ABSTRACT Global Status Report on Road Safety 2013 shows that about 12.4 lakh people were killed around the world due to Road Traffic Accidents (RTAs) in 2010. In India, there is one road accident every minute and one death every four minutes. It is surprising to note that, out of 28 States and 7 Union Territories, 13 States put together accounted for about 88.40% of all road accidents. This report examines the kinship between the RTAs and the Socio-Demographic Characters among these States. As so many factors, including Socio-Demographic factors are causes for RTAs, to find out the one to one relation between RTAs and these factors simple correlation technique is applied. The data published in the form of reports by the Government of India/WHO are used for analysis. If all other variables causing RTAs being equal, with the available primary data and by adopting a simple correlation technique, it is observed that there is a strong relationship between RTAs with Population, Number of Motor Vehicles. There is a moderate relationship between RTAs and length of road and weak relationships with Education, Urbanization and Per capita income. Keywords: Road Traffic Accidents, Socio-Demographic Factors, Registered Motor Vehicles, Population, Literacy rate INTRODUCTION A lmost 16000 people die every day around the world from all types of injuries. RTAs represent 12% of the global burden of disease, the third most important cause of overall mortality and the main cause of death among 15–44 year-olds1. Traumas due to road accidents dominate all types of injuries occur worldwide. Deaths from road traffic injuries account for about 25% of all deaths from injury2 according to the World Health Organization Report. (Figure1) 3%. The economic burden on the permanently disabled people who are the bread winners of the family is not taken into account in this. It is understandable that India, which is a vast country, second highest populated in the world, spread over 3,287,590 sq. km5 area with 29 States and 9 Union Territories accounts for the highest number of accidents in the world. But in India out of the 29 States, 13 states Tamil Nadu, Maharashtra, Madhya Pradesh, Karnataka, Andhra Pradesh, Kerala, Uttar Pradesh, Gujarat, Rajasthan, Chhattisgarh, West Bengal, Haryana and Bihar alone contribute to 88.80% of accidents in 2012 and 88.42% of accidents in 2013. It is surprising to note that the top 5 states contribute to 55.51% of accidents, out of this, three are South Indian States and the 6th one is Kerala which completes the list of South Indian States. The cause for higher number of accident occurrence 1 among this states is analysed in this paper. (Table ) A World Bank study has shown that the economic development of nations is associated with an increase in the number of injuries and deaths from road traffic 6 crashes . Figure 1: Distribution of Global Injury Mortality by cause, 2000 RTAs are one of the leading causes of fatalities all over the world, and the maximum number of fatalities occur in India every year, in the year 2013 in about 4,86,476 road 3 accidents, 1,37,572 people were killed . National Crime Records Bureau statistics show that close to 14 people perish in India every hour due to RTAs. According to Global Status Report on Road Safety 2013, the estimated GDP loss4 due to Road Traffic crashes in India is around In India, injury and death rates are dissimilar among states and union territories and the trends generally do not conform to trends7 seen in the population growth rate or number of vehicles (Nitin Garg, Adnan A. Hyder). Charles O. Bekibele attributes the increase in the number of RTAs in Developing Countries8 in part due to urbanization, industrialization, as well as the increase in the number of motor vehicles on the roads (Charles O. Bekibele, Olafunmilayo I. Fawole, Afolabi E. Bamgboye, Lola V Adekunle, Ronke Ajav and Aderonke M. Baiyeroju). International Journal of Pharmaceutical Sciences Review and Research Available online at www.globalresearchonline.net © Copyright protected. Unauthorised republication, reproduction, distribution, dissemination and copying of this document in whole or in part is strictly prohibited. 137 © Copyright pro Int. J. Pharm. Sci. Rev. Res., 33(2), July – August 2015; Article No. 28, Pages: 137-144 But it will be interesting to note that, as per the study of R. J. Sameed, though the increase in the number of vehicles leads to increase in number of road accidents, increase of vehicle ownership leads to a decrease in 9 fatalities per vehicle . A study conducted by Francisco 10 Rivas-Ruizl suggests that “All other variable being equal, a higher proportion of kilometers available on high capacity roads and a higher and cultural, education level were associated with lower death rates due to RTI”. The factors related to the traffic environment, such as traffic density, number of vehicles, and types of vehicle, are associated with higher road traffic mortality11,12. ISSN 0976 – 044X Socio-demographic factors are also known to contribute to traffic injury in the general population. Several studies have shown that low socioeconomic status is associated 13 with traffic injury on an individual level , a regional 14 15 level , and a national level . This paper studies the Socio-Demographic Characters of these states and the relationship between RTAs and these Socio-Demographic Characters. From demographic characteristics of a specific region/country, the overview of its population, size, social mobility and other things can be understood. Table 1: Comparative Statement Between RTAs and Socio Demographic Factors in India (13 States Where Maximum Accidents Occur) Total No of Accidents per Lakh population No of Towns % Literacy Rate % Total No of Accidents per 10000Km of Roads Average per capita Income RS S. No Name of State RTAs % Registered Motor Vehicles % 1 Andhra Pradesh 8.67 7.80 50.30 2.99 67.66 1695.60 78177 2 Bihar 2.10 2.00 22.40 1.68 63.82 736.40 28317 3 Chattisgarh 2.76 1.90 9.40 1.54 86.43 1803.10 52689 4 Gujarat 5.70 9.00 40.60 2.94 79.31 1556.30 98635 5 Haryana 2.05 3.70 39.90 1.30 76.64 2458.40 122620 6 Karnataka 9.06 6.80 69.90 2.93 75.60 1452.20 77015 7 Kerala 7.38 4.30 104.50 4.40 93.91 1634.60 89016 8 Madhya Pradesh 10.44 5.10 68.80 4.03 70.63 2574.30 43864 9 Maharashtra 13.52 12.20 54.40 4.52 82.91 1588.60 107670 10 Rajasthan 4.68 5.60 22.20 2.51 67.06 949.00 59109 11 Tamil Nadu 13.82 10.90 89.20 9.28 80.33 2877.40 98550 12 Uttar Pradesh 6.11 9.70 22.40 7.74 69.72 759.50 33269 13 West Bengal 2.51 2.40 8.20 7.69 77.08 394.50 62831 TOTAL 88.80 81.40 602.20 53.55 991.10 20479.90 951762.00 Average 6.83 6.26 46.32 4.12 76.24 1575.38 73212.46 MATERIALS AND METHODS Socio-demographic factors and road accidents Road accidents causative factors Socio-Economic Status16 is generally recognized as an important predictor for RTAs. The relationship between RTAs and some of the Socio-Demographic Characters are discussed below. World-wide from many studies the following genes are believed to cause an impact on RTAs. To obtain an appropriate measure of RTAs, normalized / standardized accident rate per Lakh population, per 10000 vehicles, per 10000km of road length are taken into account. The major factors to compare RTAs are considered to be. The main Road Traffic Accident causative factors are: Human Vehicle Road Environment and combination of one or the other. The Road and Environment (but for some states in hilly terrain), Vehicle all over India remain almost same. Then why accidents occur in more numbers in some particular states? Some socio-demographic factors are taken into consideration and the causes for higher number of road accidents are analyzed. i) Population/Population Density ii) Number of Registered Motor Vehicles iii) Length and Quality of Roads iv) Literacy Rate, Culture of people International Journal of Pharmaceutical Sciences Review and Research Available online at www.globalresearchonline.net © Copyright protected. Unauthorised republication, reproduction, distribution, dissemination and copying of this document in whole or in part is strictly prohibited. 138 © Copyright pro Int. J. Pharm. Sci. Rev. Res., 33(2), July – August 2015; Article No. 28, Pages: 137-144 v) Urbanization vi) Per capita Income / Standard of Living of people. (Comparison has shown in Annexure I) ISSN 0976 – 044X per lakh population is shown in the figure 2. This clearly indicates that the accident is on the higher position of middle income states. (Figure2) More population with higher literacy rates and with higher per capita income leads to more number of motor vehicles on the road which in turn leads to more road accidents and fatalities. These are the reason for selecting these factors and it is to be seen whether there is any correlation between these factors and RTAs. As so many other factors also leads to RTAs, to compare the one to one relationship between RTAs and the above factors, correlation between them are found out and considered for analysis. The data for the above items had been taken from primary data published in the form of reports Road Accidents in India 2013, Global Status Report on Road Safety 2013, Basic Road Statistics of India 2008-09, 200910 & 2010-11 etc., mostly published by Government Agencies. Correlation measures17 the strength and linear relationship between the variables. The value of correlation coefficient will be between +1 and -1. Positive and negative correlation means that the variables are directly proportional or inversely proportional to each other. If the value is zero, which means there exists no relationship between these two variables. A correlation coefficient greater than 0.8 is generally described as strong, whereas a correlation less than 0.5 is generally described as weak. To find correlation one of the most commonly used formulas in Statistics is Pearson’s Correlation Coefficient. R- Pearson correlation coefficient, Figure 2: Road Traffic Death Rates per 100000 population, by country income status The correlation coefficient value of R is 0.7121 between the RTAs (x) and population (y) for the top 13 states with the most number of accidents. This is a relatively strong positive correlation, which implies there is a strong relationship between RTAs and increase in population. The value of R2, the coefficient of determination, is 0.5071. This goes in line with the study by Boakye Agyemang, Dr G. K. Abledu, Reuben Semevoh20 which revealed that there exists a strong positive correlation between RTAs and population in Ghana. More vehicles more accidents? Motor Vehicle Population in India has grown at a rate of 10.5 % (Compound Annual Growth Rate CAGR) during the period 2002-2012. In tandem, traffic hazards and exposure have also risen. The relationship between Road Accidents and number of Motor vehicles is examined. The ratio of vehicle population and among the High income, Middle income and Low income countries is given in Figure 3. X- RTAs Y- Socio Demographic factors taken up for analysis The coefficient of determination, r 2 gives the proportion of the variance (fluctuation) of one variable that is predictable from the other variable. The value will be between 0 and 1. More population more accidents? The population density of India in 2011 is 382 per sq km while the urban population is 31.60 % of the total population. Road Traffic Injuries are the leading cause of death18 for young people aged between 5 and 2919 who are the future of the nation. Worldwide the accident rate Figure 3: Population, road traffic death and registered motor vehicles, by country income status In India, Maharashtra accounted for the largest share (14%) of the registered vehicles in the country as at end March 2009 followed by Tamil Nadu (12%), Gujarat (10%) and Uttar Pradesh (10%). These four States together accounted for about 46%21 of the total vehicles registered up to 31.3.2009. Tamil Nadu one of the 13 States with International Journal of Pharmaceutical Sciences Review and Research Available online at www.globalresearchonline.net © Copyright protected. Unauthorised republication, reproduction, distribution, dissemination and copying of this document in whole or in part is strictly prohibited. 139 © Copyright pro Int. J. Pharm. Sci. Rev. Res., 33(2), July – August 2015; Article No. 28, Pages: 137-144 ISSN 0976 – 044X more RTAs, occupies seventh place in terms of population, stands second in terms of number of vehicles, but first in terms of road accidents. traffic context believe traffic rules (a myth?). Thus a direct correlation test between RTAs and Literacy rate among these states is carried out. People in developing countries, which comprise 84% of the global population, currently own around 40% of the world's motor vehicles22. Road Traffic Accident increases at a fast rate in developing countries due to rapid motorization and other factors23. Contrary to our belief, the correlation coefficient between RTAs (x) and Literacy rate (y), R is 0.1859 (Nearer the value is to zero, the weaker the relationship). Although technically a positive correlation, the relationship between the variables is weak. Surprising, is it not?. The value of R2, the coefficient of determination, is 0.0346. The correlation coefficient between RTAs (x) and Number of Motor Vehicles (y), R is 0.7856. This is a strong positive correlation, which means that no of accidents increase with an increase in the number of vehicles. The value of 2 R , the coefficient of determination, is 0.6172. This means the increase in the number of vehicles leads to increase in number of accidents. This reflects Do-Gyeong Kim’s finding in 2006 “the number of accidents also increases with traffic volume and positive correlation exists between traffic volume and accidents”. This is almost close to the study by Ehsanollah Habibi, Azam Haghi, Mohammad Reza Maracy, Investigating the prediction of risk-taking attitudes and behaviours among Iranian drivers26, which shows that there is a significant relationship between the rate of risk taking and educations. In fact, risk taking in those who have BSC and upper degree is significantly more than that of those who 4 are under diploma. (Figure ) More roads more accidents? With the growth in population, number of motor vehicles, the distance of the road will naturally increase. Has the increase been proportional? That is an important question need to be discussed and analyzed. In the United States of America, they usually say “Roads are not the means of transport, they are the backbone of our nation” and this holds good for every nation on the globe. Road transport is one of the important ingredients for the economic growth of any nation. India’s road density averages about 1.42 km24 of road length per square km of land and is much higher compared to USA (0.67 km/sq.km), China (0.40 km/sq.km) and many other countries25. For the mobility of goods and people the road network need to be expanded. But India’s road network has grown at an annual rate of 4% since 1951 but the number of vehicles has increased nearly 11% that lead to choking roads which in turn lead to traffic congestion and the possibility of accidents. But with the available data if the coefficient of correlation is calculated, the correlation coefficient between RTAs (x) and Accident per 10000km length of Roads (y), R is only 0.5062. This is a moderate positive correlation, which implies there is a tendency to increase in RTAs with an increase in Road Length. The value of R2, the coefficient of determination, is 0.2562. Figure 4: Relationship Between the Rate of Risk Taking and Educations More urbanization more accidents? Urbanization in India after independence was mainly due to the adoption of a mixed system of economy and development of factories, companies in the private sector. Urbanization in India is taking place at a faster rate. The exponential growth of the urban population due to industrialization, leads to unplanned growth of urban areas, which leads to the desperate lack of infrastructure are the main causes of RTAs. In India, the towns having 27 population more than one lakh are about 302, which were only 151 in 1971. If the same trend is followed, it is expected that more than 85 crore people in India will live in towns by 2050. (Figure5) More literacy rate less accidents? Educational achievement was also identified as a factor in injury due to RTAs (LaScala). When we consider Road Safety and RTAs, 4Es need to be looked at first, out of this 4Es, Education is one. Though the Education in this context doesn’t necessarily mean formal education, but the general belief is that well educated people will behave in a better and proper way, abide all the rules, in Figure 5: India’s pace of urbanization International Journal of Pharmaceutical Sciences Review and Research Available online at www.globalresearchonline.net © Copyright protected. Unauthorised republication, reproduction, distribution, dissemination and copying of this document in whole or in part is strictly prohibited. 140 © Copyright pro Int. J. Pharm. Sci. Rev. Res., 33(2), July – August 2015; Article No. 28, Pages: 137-144 The exponential growth of urban population, lack of necessary infrastructure leads to traffic bottleneck and traffic congestion, which in turn will lead to RTAs. The 28 road length per vehicle was 3 km in 1971 which reduced to 2 km in 1981, 1.3 km in 1991, 0.68 km in 1998 and 0.23 km in 2004. Delhi is taken up for example to compare this. (Figure6) ISSN 0976 – 044X for reasons well known that with the increase in per capita income the purchase power increases which holds good for the purchase of motor vehicles. As already discussed, the growth of motor vehicles will normally lead to the increase in road accidents. The growth of motor vehicles in developed / developing countries is driven by the consumers’ wealth level30. With the increase in economical level the rate of fatalities due to other disease tend to decline due to the increase in facilities but road accidents are the only exception. The economic growth is accompanied by the growth in motor vehicles that increase RTAs31. The correlation coefficient between RTAs (x) and per capita income (y) in these states, R is 0.3191. Although technically a positive correlation, the relationship between your variables is weak. The value of R2, the coefficient of determination is 0.1018. But in a study, Garg and Hyder (2006) found a strong positive relationship between income and the road traffic crash32 fatality rate over a cross-section of Indian states. RESULTS AND DISCUSSION Figure 6: Transport Infrastructure in Delhi During the year 2013, 22.70% of RTAs had occurred in 50 cities with more than one million population. Hence the number of towns in these States is taken up for analysis. The correlation coefficient between RTAs (x) and a number of towns (y), R is 0.4414. Although technically a positive correlation, relationship between the variables is weak. the The value of R2, the coefficient of determination, is 0.1948. More percapita income less accidents? A World Bank study has shown that the economic development of regions and nations is associated with an increase in the number of injuries and deaths from road traffic crashes (Kopits E, Cropper)29. In this study, per capita income is taken as the indicator of economic development. But commonly it is presumed that with the economic growth, the fatalities due to Road accidents will reduce for reasons obvious that are the increase in educational level, better infrastructure and development of sophisticated better equipped vehicles. But the road fatalities in developing countries increase with growth in the economy. Worldwide, in most of the comparison on RTAs, per capita income is regarded to be one of the major factors, From this study it is observed that, if all other variables causing RTAs being equal, analyzing with the available primary data and by adopting a simple correlation technique, there is a strong relationship between RTAs and Population, Number of Motor Vehicles confirming the finding by Bishai (2006) and Kopits and Cropper (2008), that in poor countries the rise of motorization that accompanies income growth is one of the most significant forces in the increase in road accident fatalities per population; fatalities per vehicle decline in fact over time. There is a Moderate relationship between RTAs and length of road and weak relationships with Education, Urbanization and Per capita income. As per the report of the International Road Federation World Road Statistics 2009, it is understood that of the upper middle income group which have a population of 13%, the RTA fatality is 23%, in the lower income group, the population is 18% and the RTA fatality is only 10%. In the lower middle income group and high income group countries, both are almost proportional and this goes almost in line with our results. But in terms of RTAs and Motor Vehicles, the results are contradictory. Higher income group which has 65% of vehicle population have only 17% of Road fatalities. Middle income, Lower income group which has 35% of vehicles have 83% of fatalities. The reason may be the type of vehicle they possess. And also as per WHO’s Global Status Report on Road Safety which states that over 90% of the world’s fatalities on the roads occur in low and middle income countries, although these countries only have about 48% of the 7 world’s registered vehicles. (Figure ) International Journal of Pharmaceutical Sciences Review and Research Available online at www.globalresearchonline.net © Copyright protected. Unauthorised republication, reproduction, distribution, dissemination and copying of this document in whole or in part is strictly prohibited. 141 © Copyright pro Int. J. Pharm. Sci. Rev. Res., 33(2), July – August 2015; Article No. 28, Pages: 137-144 ISSN 0976 – 044X Figure 7: Comparison by income group, road traffic deaths and motor vehicles And in terms of urbanization, per capita income, educational level and road length in the upper income group countries with higher amount of urbanization have less number of RTAs. More per capita income, higher percentage of education and higher road length do have less number of RTAs. It means that these factors have an inverse relationship with RTAs which doesn’t hold well in Indian context. These may be due to other external factors which are not covered in this study. Limitations The limitations of the study are that the study relies on the available primary data released from Government Agencies. No data collected separately. To find out the relationship, the simple correlation technique is adopted and only six factors are considered. There are so many other factors which play role in RTAs, like the level of enforcement of Traffic rules and laws which may vary from state to state, culture of people, details about the occurrence of accidents and the type of road (NH, SH, MDR, ODR Village Roads), Prohibition of liquor (drunken driving is a major cause for RTAS) etc. CONCLUSION From the Road Accidents Reports released by Transport Research Wing, Ministry of Road Transport and Highways, India and by many other world organizations, it is obvious that RTAs are one of the biggest threats to human life in India. A developing country like India certainly cannot afford this social and financial loss. If population is considered as one of the main criteria, China, which have a higher population than India had reduced the RTAs from 450254 in 2005 to 219521 in 2010 and fatalities due to RTAs over the same period had gone down from 96738 to 65225. Whereas India over the same period had shown an increasing trend in both cases (RTAs 439255 in 2005 to 499628 in 2012 and fatalities due to RTAs 94968 to 134513). Necessary measures need to be taken to reverse this trend. Accidents can be avoided by self-discipline and or stringent enforcement of laws33. If the Developed countries with better literacy rate have less RTAs which doesn’t hold good in India means, the educational level about Road Safety here is not up to the mark and Road Safety Education should be taught from school education itself (included in the curriculum). The reason for more vehicles and less RTAs in developed countries and the reverse in Middle and Low income countries may be due to the type of vehicle they possess, here people own mostly two wheelers, which are more prone to accidents than well equipped cars owned by the people of a developed nation. But in any case with better education about road safety, by developing good attitude, behaviour on road with concern over others, good value and culture the RTAs will certainly get reduced and invaluable human lives will not be lost. Though India leads the pack in terms of RTAs and fatalities, the studies and research in these areas are very limited. The statistics available are also being very few. Necessary actions for promoting research may be initiated by the Government, Educational Institutions and Non-Governmental Organizations. International Journal of Pharmaceutical Sciences Review and Research Available online at www.globalresearchonline.net © Copyright protected. Unauthorised republication, reproduction, distribution, dissemination and copying of this document in whole or in part is strictly prohibited. 142 © Copyright pro Int. J. Pharm. Sci. Rev. Res., 33(2), July – August 2015; Article No. 28, Pages: 137-144 Prevention, 43(1), 2010, 11­24. REFERENCES 1. WHO, The world health report 2001. Mental health: new understanding, new hope. Geneva, World Health Organization, 2001. Impact of Disorders –P27, Fig2.2. 2. Peden M, McGee K, Sharma G. The injury chart book: a graphical overview of the global burden of injuries. Geneva, World Health Organization, 2002. Ch.1. An overview of the global burden of injury, P -9. 3. 4. Road Accidents in India 2013, Government of India, Ministry of Road Transport and Highways, Transport Research Wing, New Delhi. Table 1.2: Number of Road Accidents and Number of Persons Involved: 2003-2013, P 4. Global Status Report on Road Safety 2013 Supporting a Decade of action World Health Organization. Country Profiles, India, P137. 5. National Portal of India, Available http://india.gov.in/india-glance/profile, Geography,[Accessed on 24.12.2014]. 6. Mojtaba Sehat, Kourosh Holakouie Naieni, Mohsen AsadiLari, Abbas Rahimi Foroushani, and Hossein Malek Afzali, Socioeconomic Status and Incidence of Traffic Accidents in Metropolitan Tehran: A Population based Study, Int J Prev Med. 3(3), Mar 2012, 181–190, PMCID: PMC3309632 from: Profile, 7. Nitin Garg, Adnan A. Hyder, Exploring the relationship between development and road traffic injuries: a case study from India. European Journal of Public Health, 16(5), 487–491, doi:10.1093/eurpub/ckl031 8. Charles O. Bekibele, Olafunmilayo I. Fawole, Afolabi E. Bamgboye, Lola V Adekunle, Ronke Ajav and Aderonke M. Baiyeroju, Risk factors for RTAs among drivers of public institutions in Ibadan, Nigeria, African Journal of Health Sciences, Volume 14, Number 3-4, July-December 2007. 9. ISSN 0976 – 044X Smeed, R.J. Some statistical aspects of road safety research, Journal of Royal Statistical Society, Series A (General), 112(1), 1949, 1-34. 10. Francisco Rivas­Ruiz, Emilio Perea­Milla and Alberto Jimenez­Puente, Geographic variability of fatal road traffic injuries in Spain during the period 2002–2004: an ecological study, BMC Public Health, 7, 2007, 266 doi:10.1186/1471­2458­7­266 15. Van Beeck EF, Mackenbach JP, Looman CW, Kunst AE: Determinants of traffic accident mortality in The Netherlands: a geographical analysis. International Journal Epidemiol, 20(3), 1991, 698­706. 16. Mojtaba Sehat, Kourosh Holakouie Naieni, Mohsen Asadi­Lari, Abbas Rahimi Foroushani, and Hossein Malek­Afzali, Socioeconomic Status and Incidence of Traffic Accidents in Metropolitan Tehran: A Population­based Study International Journal of Preventive Medicine, Int J Prev Med. 3(3), Mar 2012, 181–190, PMCID: PMC3309632 17. Finding Your Way Around, Statistics 2, Available from:MathBits.com http://mathbits.com/MathBits/TISection/Statistics2/correl ation.htm.[Accessed on 25.12.2014]. 18. Murray CJL. Global and regional mortality from 235 causes of death for 20 age groups in 1990 and 2010: a systematic analysis for the Global Burden of Disease Study 2010. Lancet, 380, 2012, 2095–2128. 19. WHO methods and data sources for country­level causes of death 2000­2012, Department of Health Statistics and Information Systems WHO, Geneva, May2014. 20. Global Health Estimates Technical Paper WHO/HIS/HSI/GHE/2014.7, Figure 3.2. Percentage of deaths by cause and age for India: comparison of final GHE estimates for year 2002 with national­level results from the Million Death Study, 2001­2003, Available from: http://www.who.int/healthinfo/statistics/GlobalCOD_meth od.pdf [Accessed on 24.12.2014]. 21. Dr G. K. Abledu, Reuben Semevoh, Regression Analysis of RTAs and Population Growth in Ghana Boakye Agyemang, International Journal of Business and Social Research (IJBSR), 3(10), October 2013. 22. Road Transport Year Book 2007-2009 Volume 1, State -wise Distribution of Vehicle Population, Chart 4, P VI. 23. Global Road Safety Partnership. Moving ahead: emerging lessons. Geneva: GRSP; 2001. Available from:www.grsproadsafety.org[Accessed on 25.12.2014]. 24. Vinand M Nantulya, Michael R Reich, The neglected epidemic: road traffic injuries in developing countries British Medical Journal. 324(7346), May 11, 2002, 1139– 1141. PMCID: PMC1123095 11. La Torre G, van Beeck E, Quaranta G, Mannocci A, Ricciardi W: Determinants of within­country variation in traffic accident mortality in Italy: a geographical analysis. Int J Health Geogr, 6, 2007, 49. PubMed 25. Basic Road Statistics of India 2008-09, 2009-10 & 2010-11 Government of India Ministry of Road Transport and Highways, Transport Research Wing, New Delhi, August 2012. International Comparison of Road Network, Page IX. 12. Rivas­Ruiz F, Perea­Milla E, Jimenez­Puente A: Geographic variability of fatal road traffic injuries in Spain during the period 2002–2004: an ecological study. BMC Publ Health, 7, 2007, 266. BioMed Central. 26. ‘World Road Statistics 2011’, published by International Road Federation, Geneva, Table 2.2, P10. 13. Hasselberg M, Laflamme L: Road traffic injuries among young car drivers by country of origin and socioeconomic position. Int J Publ Health, 53(1), 2008, 40­45. 27. Ehsanollah Habibi, Azam Haghi, Mohammad Reza Maracy, Investigating the predictive of risk-taking attitudes and behaviors among Iranian drivers, Journal of Education and Health Promotion. 3, 2014, 19. Published online Feb 21, 2014. doi: 10.4103/2277­9531.127599 14. Moudon AV, Lin L, Jiao J, Hurvitz P, Reeves P: The risk of pedestrian injury and fatality in collisions with motor vehicles, a social ecological study of state routes and city streets in King County, Washington. Accident Analysis and 28. Socio Cosmo, A Global Forum for an Intellectual Worldwide Online Group Discussion, Available from:http://www.sociocosmo.com/2013/07/urbanizationproblem-or-solution.html,[Accessed on 26.12.2014]. International Journal of Pharmaceutical Sciences Review and Research Available online at www.globalresearchonline.net © Copyright protected. Unauthorised republication, reproduction, distribution, dissemination and copying of this document in whole or in part is strictly prohibited. 143 © Copyright pro Int. J. Pharm. Sci. Rev. Res., 33(2), July – August 2015; Article No. 28, Pages: 137-144 29. Smriti Chand, 11 Major Problems of Urbanisation in India, P20/32 Available from: http://www.yourarticlelibrary.com/urbanisation/11-majorproblems-of-urbanisation-in-india/19880/,[Accessed on 26.12.2014]. 30. Kopits E, Cropper M. Traffic fatalities and economic growth. Accid Anal Prev, 37, 2005, 169–78. 31. Tian Wu, Hongmei Zhao and Xunmin Ou, Vehicle Ownership Analysis Based on GDP per Capita in China: 1963–2050 Sustainability 6, 2014, 4877-4899; doi:10.3390/su6084877,P4878-4899. ISSN 0976 – 044X 32. Joyce Dargay, Dermot Gately and Martin Sommer, Vehicle Ownership and Income Growth, Worldwide: 1960-2030. 33. Michael Grimm and Carole Treibich, Determinants of Road Traffic Crash Fatalities across Indian States, Working Paper No 531, January 2012, International Institute of Social Studies. 34. Road Safety is No Accident-Synthesis Report of Four Working Groups on Education, Enforcement, Engineering and Emergency Care –constituted under the National Road safety Council, Ministry of Road Transport and Highways, Government of India December 2011. Source of Support: Nil, Conflict of Interest: None. Corresponding Author’s Biography : Mr. T. Sivakumar Mr. T. Sivakumar completed his B.E Civil Engineering from Madras University, M.S Systems and Information from BITS, Pilani and M.B.A from Madurai Kamaraj University, India. He is currently doing his Ph.D at the School of Management, S.R.M University, India. He is working as Assistant Chief Engineer in Highways Department, Government of Tamil Nadu, India. Seven of his papers had been published in International Journals. He had presented three papers in International and National Conferences. International Journal of Pharmaceutical Sciences Review and Research Available online at www.globalresearchonline.net © Copyright protected. Unauthorised republication, reproduction, distribution, dissemination and copying of this document in whole or in part is strictly prohibited. 144 © Copyright pro
