Advance Journal of Food Science and Technology 10(2): 146-148, 2016
advertisement
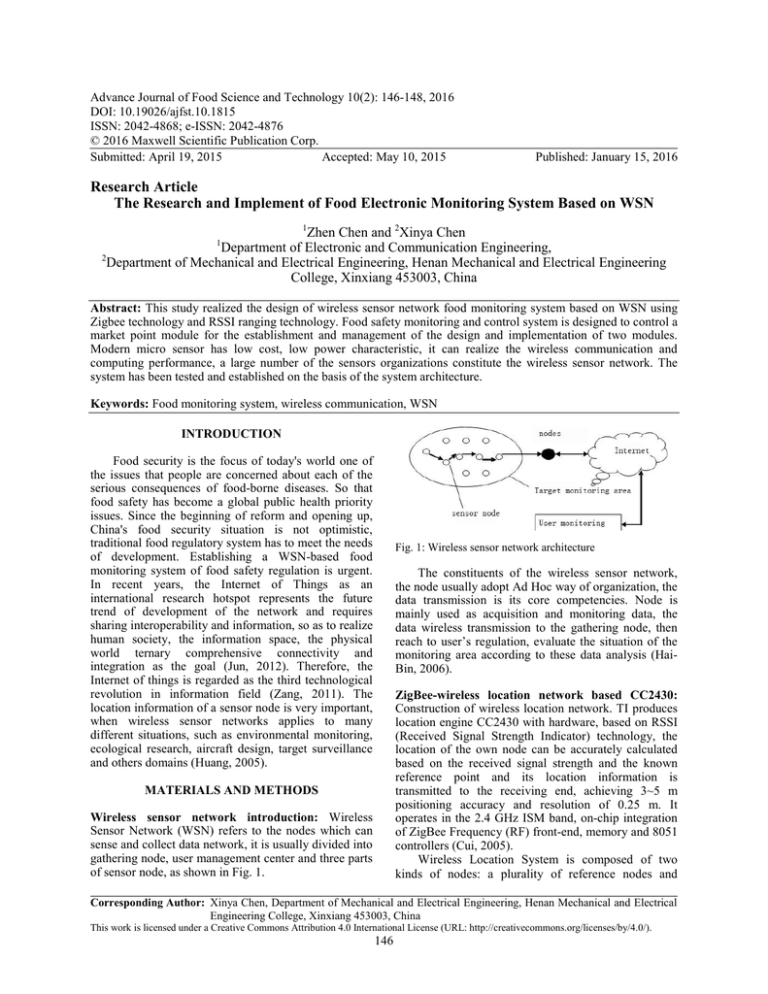
Advance Journal of Food Science and Technology 10(2): 146-148, 2016 DOI: 10.19026/ajfst.10.1815 ISSN: 2042-4868; e-ISSN: 2042-4876 © 2016 Maxwell Scientific Publication Corp. Submitted: April 19, 2015 Accepted: May 10, 2015 Published: January 15, 2016 Research Article The Research and Implement of Food Electronic Monitoring System Based on WSN 1 Zhen Chen and 2Xinya Chen Department of Electronic and Communication Engineering, 2 Department of Mechanical and Electrical Engineering, Henan Mechanical and Electrical Engineering College, Xinxiang 453003, China 1 Abstract: This study realized the design of wireless sensor network food monitoring system based on WSN using Zigbee technology and RSSI ranging technology. Food safety monitoring and control system is designed to control a market point module for the establishment and management of the design and implementation of two modules. Modern micro sensor has low cost, low power characteristic, it can realize the wireless communication and computing performance, a large number of the sensors organizations constitute the wireless sensor network. The system has been tested and established on the basis of the system architecture. Keywords: Food monitoring system, wireless communication, WSN INTRODUCTION Food security is the focus of today's world one of the issues that people are concerned about each of the serious consequences of food-borne diseases. So that food safety has become a global public health priority issues. Since the beginning of reform and opening up, China's food security situation is not optimistic, traditional food regulatory system has to meet the needs of development. Establishing a WSN-based food monitoring system of food safety regulation is urgent. In recent years, the Internet of Things as an international research hotspot represents the future trend of development of the network and requires sharing interoperability and information, so as to realize human society, the information space, the physical world ternary comprehensive connectivity and integration as the goal (Jun, 2012). Therefore, the Internet of things is regarded as the third technological revolution in information field (Zang, 2011). The location information of a sensor node is very important, when wireless sensor networks applies to many different situations, such as environmental monitoring, ecological research, aircraft design, target surveillance and others domains (Huang, 2005). Fig. 1: Wireless sensor network architecture The constituents of the wireless sensor network, the node usually adopt Ad Hoc way of organization, the data transmission is its core competencies. Node is mainly used as acquisition and monitoring data, the data wireless transmission to the gathering node, then reach to user’s regulation, evaluate the situation of the monitoring area according to these data analysis (HaiBin, 2006). ZigBee-wireless location network based CC2430: Construction of wireless location network. TI produces location engine CC2430 with hardware, based on RSSI (Received Signal Strength Indicator) technology, the location of the own node can be accurately calculated based on the received signal strength and the known reference point and its location information is transmitted to the receiving end, achieving 3~5 m positioning accuracy and resolution of 0.25 m. It operates in the 2.4 GHz ISM band, on-chip integration of ZigBee Frequency (RF) front-end, memory and 8051 controllers (Cui, 2005). Wireless Location System is composed of two kinds of nodes: a plurality of reference nodes and MATERIALS AND METHODS Wireless sensor network introduction: Wireless Sensor Network (WSN) refers to the nodes which can sense and collect data network, it is usually divided into gathering node, user management center and three parts of sensor node, as shown in Fig. 1. Corresponding Author: Xinya Chen, Department of Mechanical and Electrical Engineering, Henan Mechanical and Electrical Engineering College, Xinxiang 453003, China This work is licensed under a Creative Commons Attribution 4.0 International License (URL: http://creativecommons.org/licenses/by/4.0/). 146 Adv. J. Food Sci. Technol., 10(2): 146-148, 2016 (a) (b) (c) Fig. 2: FEA loading; (a): Infrared radiation flux; (b): Pulse bias voltage; (c): Equivalent DC voltage Fig. 3: An equivalent circuit in food electronic monitoring system mobile nodes. The reference node is a fixed node, its position is known. This node can send data packets to each other information on each location through the Internet. The mobile node receives the data from the respective reference nodes, by measuring the received signal strength and the position information obtained from the reference node to calculate the own position by location engine. R final = Re × Tstar = Vfid2 × Tint Re (2) I bias Considering the TCR of VO2 is -2.3% the initial resistance Rs (at 27°C) is calculated by Eq. (3) (Kruse et al., 1997) to be 139.752 kΩ: R final = Rs (1 + Electric field-coupling analysis and thermal parameter extraction: Thermoelectric field-coupling analysis assumed that the thermal pulse and bias voltage are loaded together in the three-dimensional heat-transfer model of the bolometer in food electronic monitoring. The thermal impulse is shown in Fig. 2a, with its infrared radiation flux of 2.4 nw/µm2. The initial temperature is set to 27°C. When the bolometer in food electronic monitoring is working, the pulse bias voltage is taken to prevent the VO2 thermistor overheating (Kruse et al., 1997). The typical peak of the pulse voltage bias is 1.5 V in this study. The integration time is 40 µsec and the staring time is 15 msec, as shown in Fig. 2b. To improve the simulation efficiency, the pulse voltage loading is equivalent DC voltages Veqbias as shown in Fig. 2c, which is equivalent to the pulse voltage bias in energy: Veqbias can be solved from the use of Eq. (1): 2 V eqbias V final α 1 − α (T final − Tini ) × (T final − Tini )) (3) Macro-heat-transfer model and collaborative simulation: To study the thermoelectric behavior of bolometer in food electronic monitorings in particular, it is very convenient to use the electro-thermal analogy as following: Charge: q(C) ~ Thermal Energy E (J) Current I = dq/dt (A) ~Thermal Power: P = dE/dt (W) Potential: V (V) ~ Temperature: T (K) Capacitance C = I× (dt/dV) ~Heat Capacity Cth = dQ/dT Conductivity G (A/V) ~Thermal Conductance Gth (W/K) And then an equivalent circuit of bolometer in food electronic monitoring shown in Fig. 3. It expresses both the thermal and electrical behaviors of a bolometer in food electronic monitoring. An electrical analogous circuit of thermal behavior is necessary to represent the thermal performance of bolometer in food electronic monitoring and its implementation with proper conversion factors between thermal and electrical domains. (1) According to Ohm’s law Eq. (2), the resistance of the heat-transfer model at 27.587°C Rfinal is 137.865 kΩ: 147 Adv. J. Food Sci. Technol., 10(2): 146-148, 2016 where, n = Signal propagation constant d = The distance between the sender A = Signal strength a meter far from the sender Output and input relationship based on the RSSI localization algorithm, as shown in Fig. 4. 4 Food electronic monitoring testing: Based on ARM CortexA8 hardware platform, combined with the touch screen to build friendly interface, to achieve a good impact on the real-time time food electronic monitoring and terminal instrument operating results shown in Fig. 5. Through field tests showed that the frequency of large food electronic strong interference conditions, current sensor weight, torque data will appear occasionally jump, malfunction-prone prone control circuit into account, the system uses the mean filter coefficient select 24 cycles, the test data stable and reliable. Press to write data via RS485 Modbus protocol and GPRS modules for wireless food electronic remote food electronic monitoring and management, Internet users can run real-time time food electronic monitoring and management of the food electronic through the browser interface. interface Fig. 4: Output and input relationship in RSSI CONCLUSION In this study, we did some research and positioning technology to design food monitoring system with the ZigBee technology, also reached the original design demand. We will choose a suitable location updating interval, research robustness to noise to enhance wireless LAN in order to get further research in the future. REFERENCES Cui, L., 2005. Wireless sensor network (WSN) is reviewed. Comput. Res. Develop., 1: 163-174. 163 Hai-Bin, Y., 2006. Intelligent ntelligent Wireless Sensor Networks. Science Press, Beijing, 2006: 1. Huang, C.F., 2005. The coverage problem in a wireless sensor network. Mobile Netw. Appl., 10(4): 519-528. Jun, S., 2012. Estimate localization algorithm based on RSSI model parameters. rs. Comput. Eng. Des., 33: 464-468. Zang, J.K., 2011. Based on RSSI and LQI section distance estimation algorithm. J. Commun. Technol., 2011: 100-102. Fig. 5: Collaborative simulation result RESULTS AND DISCUSSION Location algorithm based on RSSI RSSI: CC2430 positioning algorithm is based on the received RSSI (Received Received Signal Strength Indication Indication) value. RSSI value will decrease with increasing distance: RSSI = − (10 n log 10 d + A) (4) 148


