Research Journal of Applied Sciences, Engineering and Technology 5(4): 1197-1202,... ISSN: 2040-7459; e-ISSN: 2040-7467
advertisement
Research Journal of Applied Sciences, Engineering and Technology 5(4): 1197-1202, 2013
ISSN: 2040-7459; e-ISSN: 2040-7467
© Maxwell Scientific Organization, 2013
Submitted: June 22, 2012
Accepted: August 17, 2012
Published: February 01, 2013
Detection of Edible Oils Based on Voltammetric Electronic Tongue
Hong Men, Caiwa Zhang, Ke Ning and Donglin Chen
Department of Automation Engineering, Northeast Dianli University, Jilin, 132012, China
Abstract: A voltammetric electronic tongue to classify five different types of edible oil samples is described in this
study. The standard three-electrode configuration composes the sensor array: gold electrode, platinum electrode and
saturated calomel electrode. Using cyclic voltammetric measurement, respectively, on five different types of edible
oil samples (peanut oil, corn oil, soybean oil, sesame oil and sunflower oil) collected data. The data extracted from
the cyclic voltammetry are processed by three algorithms: Principal Component Analysis (PCA), Factor Analysis
(FA) and Hierarchical Cluster Analysis (HCA). The result shows that the voltammetric electronic tongue could
discriminate all of the five edible oil samples very well.
Keywords: Edible oils, electronic tongue, hierarchical cluster analysis, hierarchical factor analysis, principal
component analysis
INTRODUCTION
Electronic tongue is composed of sensor array,
signal processing module and pattern recognition
module. The samples are classified by the response
signal from the sensor array. Electronic tongue has
found increasing interest for recognizing and
differentiating foodstuffs on the basis, for instance, of
their geographical origin or manufacturing processes
(Ciosek et al., 2007; Toko, 1998; Parra et al., 2006;
Martina et al., 2007). A variety of chemical sensors has
been employed in the design of electronic tongues,
embracing mass, optical and electrochemical systems.
Different types of electronic tongues are developed,
such as the voltammetric electronic tongue (Fredrik
et al., 1997), the potentiometric electronic tongue (Jordi
et al., 2005), the impedance-based electronic tongue, the
hybrid electronic tongue and so on.
Electronic tongue could recognize the various
samples such as fruit juices, still drinks, milk and could
follow the aging processes of milk and orange juice.
Michele Forina and others described an electronic
tongue which was able to classify different types of
edible oil. For the past few years, there has been a
growing interest among consumers in the safety and
trace ability of food products. In particular, there has
been an increasing focus on the geographical origin of
raw materials and finished products, for several reasons
including specific sensory properties, perceived health
values, confidence in locally produced products and
media attention. In order to assure quality and to
safeguard consumers from commercial frauds, there is
an increasing need for analytical tools able to verify
whether a product, sold with a specific label, is actually
compatible with that claim or not. Physico-chemical
techniques (GC, GC-MS, HPLC), chemical analysis and
sensorial analysis (panel test) are the classical methods
used for this purpose. Each of these analyses only gives
partial information about the extent of oxidation. They
are expensive and time consuming. In recent years,
considerable efforts have been devoted to the
development of innovative analytical instrumentation
such as the electronic tongue, which can mimic the
human sense of olfaction and of taste and provide lowcost and rapid sensory information for monitoring food
quality and state of a process.
In this study, we propose a new strategy to perform
voltammetric measurements in the oil samples. All plant
oils contain some redox active compounds such as
tocopherols, polyphenols, carotenoids, etc. Therefore,
the presence of such compounds in vegetable oils could
be analysed by means of electrochemical methods. In
this study the measurement characteristics curve were
obtained with cyclic voltammetry, as for the
chemometrics strategies, classification and, foremost,
class-modelling techniques represent appropriate tools
for verifying authenticity of a product. Classification
methods-such as the Principal Component Analysis
(PCA), Factor Analysis (FA) and Hierarchical Cluster
Analysis (HCA) were used to classify five different
types of edible oil. There are three samples of each kind
of edible oil. The result shows that the voltammetric
electronic tongue could discriminate all of the samples
very well.
METHODOLOGY
Structure of electronic tongue: The electronic tongue
system is composed of the sensor array, electrochemical
Corresponding Author: Hong Men, Department of Automation Engineering, Northeast Dianli University, Jilin, 132012, China
1197
Res. J. Appl. Sci. Eng. Technol., 5(4): 1197-1202, 2013
Fig. 1: Electronic tongue system
Table 1: Samples of olive oils from different origins and varieties
Sample
Origin
Brand
Oil_1
Guangdong (China)
Jinlongyu
Oil_2
Guangdong (China)
Jinlongyu
Oil_3
Guangdong (China)
Jinlongyu
Oil_4
Tianjin (China)
Fulinmen
Oil_5
Tianjin (China)
Fulinmen
Oil_6
Tianjin (China)
Fulinmen
Oil_7
Liaoning (China)
Jinlongyu
Oil_8
Liaoning (China)
Jinlongyu
Oil_9
Liaoning (China)
Jinlongyu
Oil_10
Tianjin(China)
Fulinmen
Oil_11
Tianjin (China)
Fulinmen
Oil_12
Tianjin (China)
Fulinmen
Oil_13
Heilongjiang (China)
Jialiang
Oil_14
Heilongjiang (China)
Jialiang
Oil_15
Heilongjiang (China)
Jialiang
2.0
1.8
1.6
1.4
1.2
1.0
0.8
0.6
0.4
0.2
0.0
-0.2
-0.4
-0.6
1.0 0.8 0.6 0.4 0.2 0.0 -0.2 -0.4 -0.6 -0.8 -1.0
Potential/V
Current/le-6A
workstation, Personal Computer (PC), which is shown
in Fig. 1.
The proposed method has three stages viz. skin
segmentation to detect the hand, edge tracking for
feature extraction and particle filter for hand tracking.
The overall diagram of our method is given in Fig. 1.
The sensor array is formed by the standard threeelectrode configuration: a gold disk working electrode,
a saturated calomel reference electrode and a platinum
wire auxiliary electrode. The gold disk electrode and
platinum wire electrode are purchased from Shanghai
Chenhua Instrument limited Company. The reference
electrode is made in Ltd Rex Instrument Factory
belonging to Shanghai Precision Scientific Instrument
Company. The electrochemical workstation is also
bought from Shanghai Chenhua Instrument limited
Company. The cyclic voltammetry is applied as the
measurement principle in the electronic tongue and the
parameters are set as follows: initial potential = 1.0 V;
low potential = -1.0 V; high potential = +1.0 V; final
potential = 1.0 V; initial scan polarity: negative; scan
rate = 100 mVs-1; T = 30ºC.
Sample source: The edible oil samples under study are
shown in Table 1. They include samples of five varieties
of edible oil, samples from different geographic areas.
The edible oil samples were stored at 20ºC under dark
and unfrozen just before use.
Sample pretreatment: The oil samples heat to 30ºC
and shake, measure 30 mL and pour it 100 mL
separatory funnel, add an equal volume of 30ºC
deionized water, turbulent 5 min, still stratification will
lower water phase into a 50 mL beaker, take the beaker
into the 30ºC water bath, extract until the water
temperature stable at 30ºC, Electronic tongue measure
it. Each sample take twice, extract the average. All
samples were measured at 30ºC. Attention to
determination of next sample, the electrode head with a
large number of ethanol rinse, in order to avoid
Fig. 2: Voltammogram obtained from peanut oil
contamination of a sample of the electrode under the
influence of determination.
Data acquisition: The experimental subjects in this
experiment are five types of edible oil, including
soybean oil, corn oil, peanut oil, sunflower oil, sesame
oil. They are purchased from Darunfa supermarket in
Jilin of China. The experiment is conducted at room
temperature. The representative voltammograms
1198
Res. J. Appl. Sci. Eng. Technol., 5(4): 1197-1202, 2013
Fk = a1k X 1 + a 2 k X 2 + + a pk X p , k = 1, 2,…, r
The new data were selected (F 1 , F 2 , …, F r ) as new
matrix for cluster. Then the new matrixes were counted
by the mean score of all types in the samples to
determine the ranking. Finally, the types of the sample
order were determined according to the first the
principal component scores within the class. Principal
component analysis of the specific calculation process is
as follows:
•
In order to prevent the impact of each dimension is
different to the original data must be standardized
original variable coordinate translation and scale
transformation. Set the input sample data matrix
X n× p , the sample data normalized to:
~
xij = ( xi j − x j ) / S j , (i = 1,2,...n, j = 1,2,... p )
•
•
Current/le-7A
Fig. 3: Voltammogram obtained from corn oil
7.0
6.0
5.0
4.0
3.0
2.0
1.0
0.0
-1.0
-2.0
-3.0
1.0 0.8 0.6 0.4 0.2 0.0 -0.2 -0.4 -0.6 -0.8 -1.0
Potential/V
Current/le-6A
Principal component analysis: The principal
component analysis is a dimension reduction statistical
method, it is by means of an orthogonal transformation,
its component related to the original random vector into
its components is not related to the new random vector
performance in the algebra of the original random vector
covariance matrix of transform pairs of angular array
performance to transform the original coordinate system
into a new orthogonal coordinate system so that the
point of sample points spread most open p orthogonal
directions geometry, then the multi-dimensional variable
system down dimension, so that it can convert to a high
precision, low-dimensional variable system, by
constructing a suitable value function and further lowdimensional systems into one-dimensional system.
Principal component analysis was applied to the set of
CV responses obtained from these five different
vegetable oils as indicated in the “Experimental”
section. The best results, with regard to oil
differentiation, were obtained after column autoscaling.
R principal components were selected and counted the
scores:
Fig. 4: Voltammogram obtained from soybean oil
10.0
9.0
8.0
7.0
6.0
5.0
4.0
3.0
2.0
1.0
0.0
-1.0
-2.0
-3.0
-4.0
1.0 0.8 0.6 0.4 0.2 0.0 -0.2 -0.4 -0.6 -0.8 -1.0
Potential/V
Current/le-6A
Data processing: The data of cylic voltammetry curve
were very large. In order to reduce the data redundancy
and the burden of data processing, the data were needed
feature extraction. For the characteristics of cyclic
voltammetry curves, the eigenvalue extraction was the
peak current, the second peak current. These points
could reflect the characteristics of each substance and
greatly reduce the amount of data to be processed.
6.0
5.0
4.0
3.0
2.0
1.0
0
-1.0
-2.0
-3.0
-4.0
1.0 0.8 0.6 0.4 0.2 0.0 -0.2 -0.4 -0.6 -0.8 -1.0
Potential/V
Fig. 5: Voltammogram obtained from sunflower oil
2.4
2.1
1.8
1.5
1.2
0.9
0.6
0.3
0.0
-0.3
-0.6
-0.9
1.0 0.8 0.6 0.4 0.2 0.0 -0.2 -0.4 -0.6 -0.8 -1.0
Potential/V
Current/le-6A
corresponding to each kind of tea are shown in
Fig. 2 to 6, which will be processed as the raw data.
Find the covariance matrix Z
Characteristics of decomposition Z = UΛU t , is
Fig. 6: Voltammogram obtained from sesame oil
about to axis rotation to new axes U: eigenvalues
1199
Res. J. Appl. Sci. Eng. Technol., 5(4): 1197-1202, 2013
•
•
for the covariance matrix Z consisting of diagonal
matrices ∧ ; U characteristic vectors by column
orthogonal matrix Z, it constitutes a new vector
space, also known as the load axis as the axis of the
main ingredients, the characteristic value indicates
the size of the principal component of variance to
determine the number of principal components
according to their size.
According to the cumulative contribution rate η m is
greater than the threshold, can be considered the
principal component number m.
Find the value of the principal components, each
line of the F matrix is equivalent to the projection
of the vector of the original data matrix in the
principal component axes, the principal component
score vector.
Factor analysis: Factor analysis of each original
variable into two parts: part of the few factors common
to all variables and the so-called public factors were
partially, another part of the factors of each variable
alone, the so-called unique factor parts. Factor analysis
is a data reduction technology. Internal dependencies
between the number of variables of the study and
explore the basic structure of the observational data and
a few hypothetical variables to represent the basic data
structure. These hypothetical variables that reflect the
main message of the original number of variables. The
original variables can be observed in the variable the
imaginary variable is the potential unobserved variables
called factors. Its mathematical model is:
Set variables as X i (i = 1, 2,…, p), expressed as:
X i = µ i + ai1 F1 + ..... + aim Fm + ε i (m ≤ p)
F1 , F2 ,....., Fm as the common factor is an
unobservable variable, their coefficients are called factor
loadings ε i is a special factor, the first m common factor
cannot be included in part, and satisfy:
diversified pavement condition indicators. Hierarchical
Cluster Analysis theory includes three major application
methods, namely, Hierarchical Cluster Analysis,
Dynamic Cluster Analysis and Optimal Partition
Analysis, each of which has its own application
conditions. Hierarchical Cluster Analysis application
steps are demonstrated as follows:
Step 1: To calculate the distance d ij between two
samples:
m
Step 2: To merge two nearest samples into a new class
at a time and then the total number o f segments l will
decrease by one segment namely l = n – i + l.
Step 3: To calculate the distance between the new class
and other classes and then combine two nearest classes.
Referring to the following equation:
2
D pq
=
1
n p nq
∑d
2
ij
i∈G p , j∈Gq
Note that,
D pq : The distance between class D p and class D q
n p : The number of samples of class G p and n q for
class G q
Step 4: To repeat step three and step four to obtain a
new distance matrix. If the number of classes after
combination is still larger than 1, then to repeat step
three and step four until the number of classes
remains 1.
When class G p and class G q are combined into G r
(G r = {G p , G q } and n r = n p + n q , n r is the number of
samples of G r ), the recursion formula of the distance
between class G r and other classes G s is:
Drs2 =
Hierarchical cluster analysis: Hierarchical Cluster
Analysis is a statistical method which can be described
as “birds of a feather flock together”. It looks for
statistics that can objectively reflect the similarity and
dissimilarity among the researching objects ignorant of
how m any classifications they will be and then classify
these objects into several categorizations in line with
geographic distance or attribute similarity based on the
statistics. Cluster analysis theory especially applies to
solve the problem of classifying massive samples and
*
k
cov( F , ε ) = 0
So F 1 , F 2 ,…, F m are unrelated, variance is 1.
*
d ij = ∑ x k − x jk
np
nq
2
D ps
+
nq
nr
Dqs2 ( s ≠ p, q )
In the formula, D rs is the distance between class
D ps and class D qs .
Step 5: To draw a clustering figure and decide the
number of classification and its membership.
RESULTS AND DISCUSSION
A sensor array generates data of high
dimensionality, hard to handle and visualize. First, the
original data were extracted for the Eigenvalues and
then use multivariate statistical analysis software
1200
Res. J. Appl. Sci. Eng. Technol., 5(4): 1197-1202, 2013
original data, is the variable that permits a good
separation Instead, PC2, which explains a lower
variance percentage (19.96%). which is shown in Fig. 7.
The results show that PCA can distinguish between
various types of edible oil, the classification is obvious
and the operation speed is fast, high accuracy, it can be
used for classification and identification of other
products.
As is shown in Fig. 8 present the Factor analysis
result, the samples are clustered at five independent
zones and the samples belonging to the same kind of
edible oil together. The distance between different types
of edible oil is large.
The result shows that the factor analysis algorithm
can discriminate edible oil very well. And a sample in
which the region is easier to distinguish between
classification and recognition.
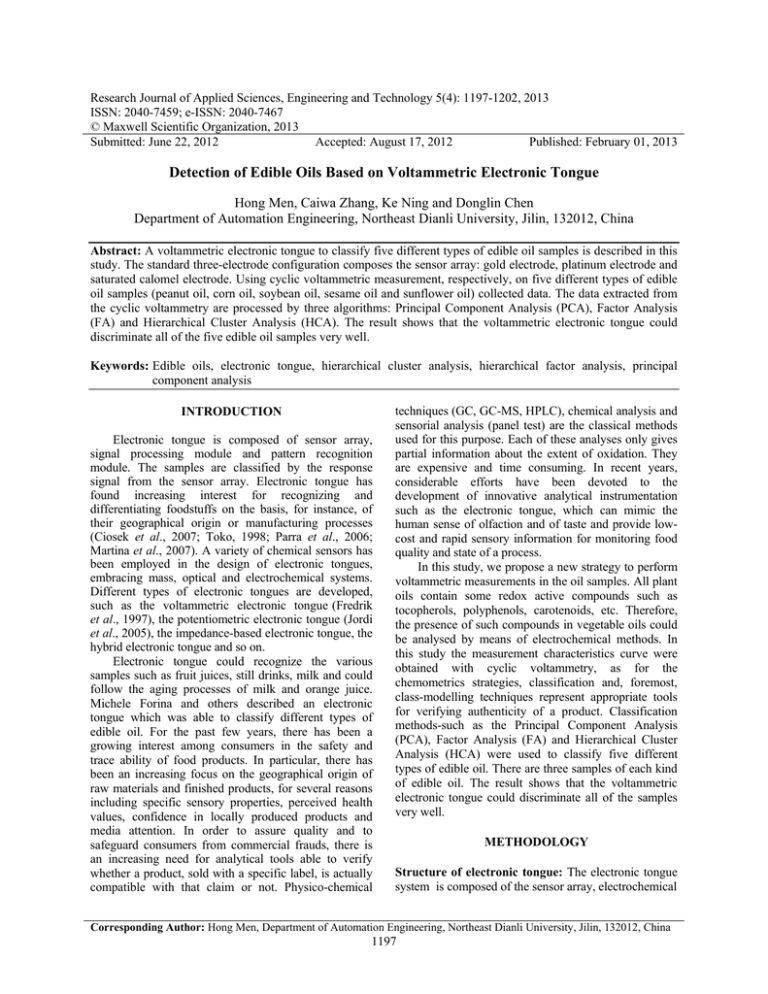
The data extracted from the voltammograms are
also processed by the cluster analysis algorithm. The
clustering result is shown in Fig. 9.
Results can show the degree of similarity between
each kind of edible oil. However, this method is
applicable to distinguish between the different kind of
oils are relatively large, the same kind of oil is quite
similar. And through human screening data for the large
amounts of data, there is the possibility of
misclassification, so this method is applicable to certain
limitations.
The identification of different types of edible oil
with above three types of pattern recognition algorithms
demonstrates that the correct rate of discrimination with
PCA and FA is better than that with HCA.
Peanut oil1
Peanut oil3
3
2
Peanut oil2
Sunflower oil3
Corn oil1
Corn oil2
Soybean oil2 Soybean oil3
0 Corn oil3Soybean oil1
Sunflower oil2
-1
Sunflower oil1
Sesame oil1
-2 Sesame oil2
PC2
1
-3
Sesame oil3
-4
-5.0
-2.5
0.0
2.5
PCI
5.0
7.5
10.0
Fig. 7: The PCA score plot
1.5
1.0
Factor 2
0.5
Sunflower oil3
Soybean oil3
Sunflower oil2 Soybean oil2
Soybean oil1
Sunflower oil1
0.0
Peanut oil1
Peanut oil3
Peanut oil2
Corn oil1
Corn oil2
-0.5
Corn oil3
-1.0
Sesame oil1
Sesame oil2
Sesame oil3
-1.5
-2.0
-2.5
-1.5
-1.0
-0.5
0.0
Factor 1
0.5
0.1
Fig. 8: The FA score plot
CONCLUSION
Similarity
58.13
Edible oil was tested by the three-electrode
voltammetric electronic tongue system, the data were
processed by feature extraction. Based on cyclic
voltammetry electronic tongue can be a better
classification of five kinds of edible oil with the higher
recognition rate. The results showed that PCA, FA and
HCA can identify the edible oil, Principal Component
Analysis (PCA), Factor Analysis (FA) can be better
applied to the edible oil detection than Hierarchical
Cluster Analysis (HCA), but the effect of the PCA was
better than the FA. In this study, we introduce a new
method for the detection of the edible oil.
72.09
86.04
100.00
1 2 3 13 14 15 10 11 12 4 5 6 7 8 9
Observations
Fig. 9: Dendrogram of five oils (from 1 to 3 are soybean oils,
from 4 to 6 are corn oils, from 7 to 9 are peanut oils,
from 10 to 12 are sesame oils, from 13 to 15 are
sunflower oils)
MINITAB16 to linear discriminant analysis and
principal component analysis.
Figure 7 present the PCA result. This different
information is well distinguishable on the two first
principal components, respectively. In fact, PC1, which
explains 58.14% of the variance contained in the
ACKNOWLEDGMENT
This study was supported by both Jilin City
Science and Technique Project of China (No.
20106304) and Jilin Province Education Bureau Project
of China (No. 2012-100) to Hong Men.
REFERENCES
Ciosek, P. and W. Wroblewski, 2007. Sensor arrays for
liquid sensing-electronic tongue systems. Analyst,
132: 963-978.
1201
Res. J. Appl. Sci. Eng. Technol., 5(4): 1197-1202, 2013
Fredrik, W., W. Peter and L. Ingemar, 1997. An
electronic tongue based on voltammetry. Anal.
Chim. Acta, 357: 21-31.
Jordi, G., A. Salvador and V. Manuel Del, 2005.
Application of a potentiometric electronic tongue
as a classification tool in food analysis. Talanta,
66: 1303-1309.
Martina, V., K. Ionescu, L. Pigani, F. Terzi, A. Ulrici,
C. Zanardi and R. Seeber, 2007. Development of a
voltammetric electronic tongue for discrimination
of edible oils. Anal. Bioanal. Chem., 387:
2101-2110.
Parra, V., A.N.A. Arrieta, J.A. Fernandez-Escudero,
M. Iniguez, J.A. De Saja and M.L. RodriguezMendez, 2006. Characterization of wines through
the biogenic amine contents using chromatographic
techniques and chemometric data analysis. Anal.
Chim. Acta, 563: 229-237.
Toko, K., 1998. Development of an electronic tongue
based on a PEDOT-modified voltammetric sensor.
Sens. Upd., 3: 131-158.
1202
