Research Journal of Applied Sciences, Engineering and Technology 3(9): 874-879,... ISSN: 2040-7467 © Maxwell Scientific Organization, 2011
advertisement
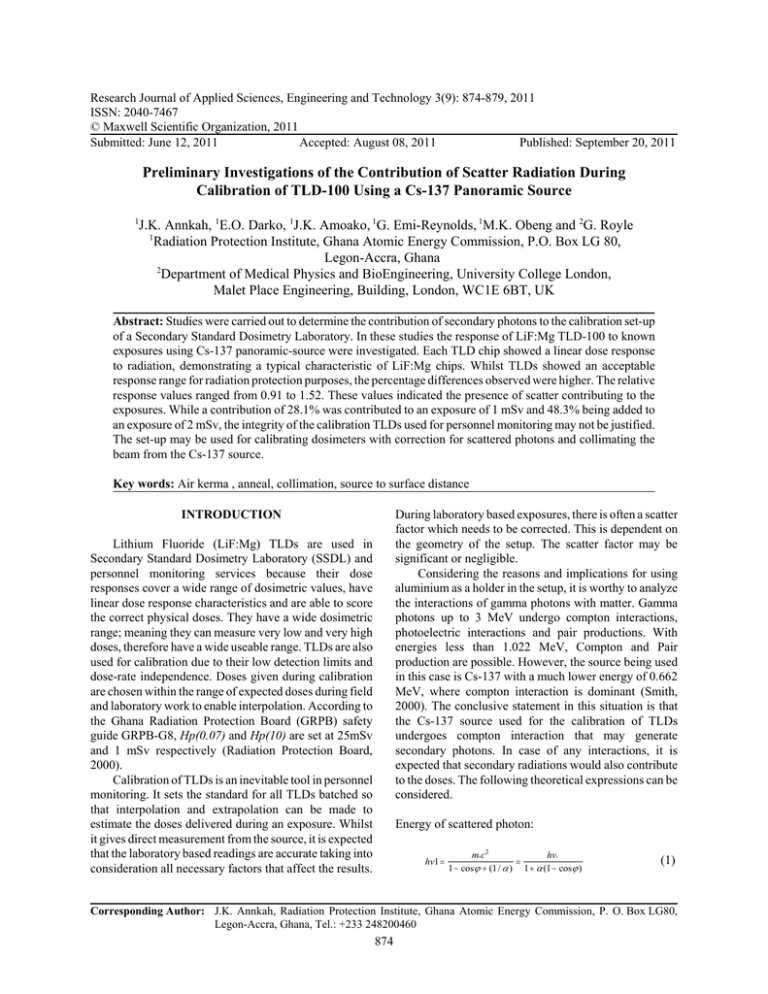
Research Journal of Applied Sciences, Engineering and Technology 3(9): 874-879, 2011 ISSN: 2040-7467 © Maxwell Scientific Organization, 2011 Submitted: June 12, 2011 Accepted: August 08, 2011 Published: September 20, 2011 Preliminary Investigations of the Contribution of Scatter Radiation During Calibration of TLD-100 Using a Cs-137 Panoramic Source 1 J.K. Annkah, 1E.O. Darko, 1J.K. Amoako, 1G. Emi-Reynolds, 1M.K. Obeng and 2G. Royle 1 Radiation Protection Institute, Ghana Atomic Energy Commission, P.O. Box LG 80, Legon-Accra, Ghana 2 Department of Medical Physics and BioEngineering, University College London, Malet Place Engineering, Building, London, WC1E 6BT, UK Abstract: Studies were carried out to determine the contribution of secondary photons to the calibration set-up of a Secondary Standard Dosimetry Laboratory. In these studies the response of LiF:Mg TLD-100 to known exposures using Cs-137 panoramic-source were investigated. Each TLD chip showed a linear dose response to radiation, demonstrating a typical characteristic of LiF:Mg chips. Whilst TLDs showed an acceptable response range for radiation protection purposes, the percentage differences observed were higher. The relative response values ranged from 0.91 to 1.52. These values indicated the presence of scatter contributing to the exposures. While a contribution of 28.1% was contributed to an exposure of 1 mSv and 48.3% being added to an exposure of 2 mSv, the integrity of the calibration TLDs used for personnel monitoring may not be justified. The set-up may be used for calibrating dosimeters with correction for scattered photons and collimating the beam from the Cs-137 source. Key words: Air kerma , anneal, collimation, source to surface distance During laboratory based exposures, there is often a scatter factor which needs to be corrected. This is dependent on the geometry of the setup. The scatter factor may be significant or negligible. Considering the reasons and implications for using aluminium as a holder in the setup, it is worthy to analyze the interactions of gamma photons with matter. Gamma photons up to 3 MeV undergo compton interactions, photoelectric interactions and pair productions. With energies less than 1.022 MeV, Compton and Pair production are possible. However, the source being used in this case is Cs-137 with a much lower energy of 0.662 MeV, where compton interaction is dominant (Smith, 2000). The conclusive statement in this situation is that the Cs-137 source used for the calibration of TLDs undergoes compton interaction that may generate secondary photons. In case of any interactions, it is expected that secondary radiations would also contribute to the doses. The following theoretical expressions can be considered. INTRODUCTION Lithium Fluoride (LiF:Mg) TLDs are used in Secondary Standard Dosimetry Laboratory (SSDL) and personnel monitoring services because their dose responses cover a wide range of dosimetric values, have linear dose response characteristics and are able to score the correct physical doses. They have a wide dosimetric range; meaning they can measure very low and very high doses, therefore have a wide useable range. TLDs are also used for calibration due to their low detection limits and dose-rate independence. Doses given during calibration are chosen within the range of expected doses during field and laboratory work to enable interpolation. According to the Ghana Radiation Protection Board (GRPB) safety guide GRPB-G8, Hp(0.07) and Hp(10) are set at 25mSv and 1 mSv respectively (Radiation Protection Board, 2000). Calibration of TLDs is an inevitable tool in personnel monitoring. It sets the standard for all TLDs batched so that interpolation and extrapolation can be made to estimate the doses delivered during an exposure. Whilst it gives direct measurement from the source, it is expected that the laboratory based readings are accurate taking into consideration all necessary factors that affect the results. Energy of scattered photon: hv1 = m° c2 hv° = 1 − cosϕ + (1 / α ) 1 + α (1 − cosϕ ) (1) Corresponding Author: J.K. Annkah, Radiation Protection Institute, Ghana Atomic Energy Commission, P. O. Box LG80, Legon-Accra, Ghana, Tel.: +233 248200460 874 Res. J. Appl. Sci. Eng. Technol., 3(9): 874-879, 2011 Energy of recoil electron, T = hv° α (1 − cosϕ ) 1 + α (1 − cosϕ ) (2) where, h<0 is the energy of the incident photon, h<1 is the energy of the scattered photon, T is the energy of the recoil electron, m0 is the rest mass, c .3.0 x 108m/s, á = h<0/ m0c2, n is the scatter angle (Smith, 2000). Both recoil electron and scattered photons may contribute to the total energy deposited and cause a misrepresentation of the assumed dose exposed.For any photon transmission, the relation between initial radiation and transmitted radiation for a collimated source is given by the expression I = Io eG:x Fig. 1: The CS-137 panoramic calibration setup at the SSDL. Source tunnel is 0.15 cm from the base of the cylinder Table 1: Distance measured from the wall Position Right Left Front (Middle) Front (Extreme end) (3) where, I is the transmitted radiation, : is the attenuation coefficient of the material, I0 is the initial radiation and x is the thickness of the material (Smith, 2000; Knoll, 1999). This expression governs the penetration of the beam through the aluminum holder during which an expected interaction is expected to contribute as secondary radiation. From the set-up, different situations can occur during exposure: (1) The beam could penetrate the aluminium wall so that there would not be any scatter contribution; (2) The beam could hit the base of the shallow cylindrical wall and undergo compton interaction, and contribute to the dose being given; (3) The beam hitting the wall after penetrating the TLD could be reflected, enter the dosimeter again causing a backscatter; (4) There could be backscatter from the wall tangential to the aluminium cylinder and contribute to the stated exposure. The setup at the Radiation Protection Institute laboratory of the Ghana Atomic Energy Commission may generate some scattered radiation. Since the laboratory is used for calibration, there is the need to investigate the presence of scatter contribution on the doses delivered and the need to eliminate them. Distance (m) 3.20 6.27 10.36 11.56 arc of the cylinder and then exposed to the Cs-137 source. The cylinder is quite shallow with an internal radius of 0.6 m (60 cm) and 0.012 m (10.2 cm) deep. The Cs-137 source is located 0.15 m (15 cm) measured vertically from the base of the cylinder. The cylindrical container is positioned 0.9 m (90 cm) from the ground. The setup is such that one of the walls of the laboratory is in contact with the cylinder tangentially. This study was conducted in this laboratory from May 2008 to December 2008 to investigate the presence of scatter contribution to the setup. Calibration of the TLDs: During calibration15 TLDs are exposed at a time and readout. Each LiF:Mg TLD is positioned at a specific location during calibration. This is to ensure that a TLD with an inconsistent response will be identified during readouts and eliminated. It is also to account for uniform dose response at that location since each TLD will be considered individually with its own response factor. Before the exposure and readout, it is required to take the dosimeters through at least three exposures and annealing cycles. The time interval between exposure and readout is 24 h and kept consistent during the calibration. Leakage readings were investigated for the source. This was done over a period of 1 and 2 h to establish leakage dose rate. Initial readings were taken to investigate the angular dependence of doses within the aluminium cylinder, and considered over 60º intervals. This was required to establish the integrity of the assumed uniform distribution. Wall measurements were taken with reference to the cylinder; The values are shown in Table 1. The wall touching the cylinder was considered to MATERIALS AND METHODS Description of irradiation facility: The Cs-137 panoramic source used for calibrating TLDs at the Secondary Standard Dosimetry Laboratory in Ghana is a non-collimated source and irradiates radially. It gives a uniform dose distribution over a spherical volume (circular area) at equidistant locations in a 3D plane (Fig. 1). The Source to Surface Distance (SSD) used for calibration is 0.6 m with TLDs placed in a cylindrical aluminium container. These TLDs are placed on the inner 875 Res. J. Appl. Sci. Eng. Technol., 3(9): 874-879, 2011 Table 2: Reader values during batching. Read 1 means first reading; read 2 means second reading; rel read means relative reading Reader's value [Msv] -------------------------------Card ID read 1 read 2 Average reading Rel read1 Rel read 2 Mean rel read % std. d of rel read 086t 1.0893 1.1258 1.1076 1.0313 1.1475 1.0894 7.54 485t 1.1728 1.4840 1.3284 1.1104 1.5126 1.3115 21.69 080t 1.0919 0.8794 0.9857 1.0338 0.8963 0.9651 10.07 305t 1.1301 1.1612 1.1457 1.0700 1.1836 1.1268 7.13 085t 1.0946 1.1090 1.1018 1.0363 1.1304 1.0834 6.14 271t 1.2289 0.9086 1.0688 1.1635 0.9261 1.0448 16.07 025t 1.0138 1.0507 1.0323 0.9598 1.0709 1.0154 7.74 504t 1.0675 0.6103 0.8389 1.0107 0.6221 0.8164 33.66 577t 0.9766 0.7889 0.8828 0.9246 0.8041 0.8644 9.86 055t 1.0609 0.8988 0.9799 1.0044 0.9161 0.9603 6.50 423t 0.9569 0.9524 0.9547 0.9060 0.9708 0.9384 4.88 077t 0.9697 0.8800 0.9249 0.9181 0.8970 0.9075 1.65 379t 0.9433 0.9236 0.9335 0.8931 0.9414 0.9172 3.72 076t 0.9907 0.9626 0.9767 0.9380 0.9812 0.9596 3.18 Table 3: Values of Hp(0.07) and Hp(10) for background and leakage in the laboratory CARD ID Reader's Value [mSv] Hp(0.07) [mSv] 379t 0.0534 0.08 076t 0.0721 0.10 077t 0.0489 0.07 504t 0.0970 0.14 577t 0.0774 0.11 055t 0.0517 0.08 423t 0.0738 0.11 305t 0.0841 0.12 085t 0.0686 0.10 271t 0.0935 0.13 025t 0.1162 0.16 080t 0.0528 0.08 086t 0.0901 0.13 485t 0.1403 0.19 Reader's Value [mSv] 0.0727 0.1019 0.0481 0.0748 0.0754 0.0416 0.0606 0.0888 0.0941 0.0736 0.1600 0.0845 0.1012 0.0275 Hp(10) [mSv] 0.16 0.20 0.12 0.16 0.16 0.11 0.14 0.18 0.19 0.16 0.28 0.17 0.20 0.09 be the back of the wall hence, “right” and “left” used in this case means the wall bearing 90º and 270º, respectively as measured clockwise from the back wall. The previous exposure was repeated with the cylindrical aluminium holder being moved away from the wall tangential to it. Measurements: The dosimeters were placed on the internal circumference of the cylindrical aluminium holder, and left there for one hour to be exposed to leakage doses with the source in the unexposed position. Records were taken for temperature, pressure and relative humidity (Knoll, 1999; Roberson and Carlson, 1992; Piesch, 1981). The TLDs were then read in the Harshaw 6600 TLD reader and the values compared to the background doses in the laboratory (Horowitz, 1990). Readings were taken at specific locations on the inner circumference of the aluminium holder. They were spaced at 60o intervals to investigate the angular variation of the dose distribution. The above readings were taken while the source was in the unexposed position. Recordings for pressure, temperature and relative humidity were recorded.All laboratory settings were left in their usual condition. The TLDs were exposed to known doses of different values. This was done to obtain reading involving all forms of scatter with the cylindrical container being left at its usual location in the lab. RESULTS AND DISCUSSION The TLDs were exposed to 1 mSv in order to batch them. Batching was necessary to obtain an acceptable response range during data acquisition. Table 2 shows the information obtained during batching. Leakage dose was checked to eliminate any doubt of leakage contribution to the expected exposure or an abnormally high background dose. The data obtained from the TLDs are shown in Table 3. The TLDs were placed on the inner arc of the cylinder whilst the source was in the unexposed position over a period of 1 h. Conditions in the laboratory were as follows: Pressure = 101.2 kPa (1012 mbar), Temperature =24ºC, and Relative Humidity = 60%. To determine the actual exposure time required to deliver a known dose to the dosimeters, there is the need to employ the decay correction factor. This is because Cs-137 undergoes radioactivity and as time elapses, the initial activity relates to the activity as of the time of using the source by the expression. 876 Res. J. Appl. Sci. Eng. Technol., 3(9): 874-879, 2011 Table 4: Calibration data for chips ii and iii Channel Ii reader's value Card ID Exposure [mSv] 080t 1.1868 423t 1.1347 076t 1mSv 1.2117 077t 1.1892 271t 1.2745 086t 2.3150 055t 2.4449 504t 2mSv 2.9677 305t 1.9683 485t 2.1274 085t 3.5011 025t 3mSv 3.3132 577t 3.9783 379t 3.1601 A = A e − λt , Average reading [mSv] 1.20 2.36 3.49 (4) ° ChannelIii reader's value [mSv] 1.0098 1.1398 1.1617 1.0994 1.1101 2.3462 2.2485 2.2498 2.3419 2.3739 3.3178 3.2144 3.8086 2.9755 Average reading [mSv] 1.11 2.31 3.33 Calibration curve of channel ii of the multi chip LTD card 4.00 3.50 3.00 2.50 2.00 1.50 1.00 0.50 0.00 0 0.5 1 1.5 2 2.5 3 3.5 Exposure(mSv) Fig. 2: Calibration curve showing the TLD response to exposure at Hp (0.07) Calibration curve of channel ii of the multi chip LTD card 3.50 3.00 TLD response (mSv) Da = Dm . PTCF, TLD response (mSv) where A is the activity present activity, A0 is the initial activity at a known time, ë is the decay constant and t is the time to the date of exposure. The dose rate at 0.6 m needs to be corrected for if dose rate had been determined at 1 m as in most cases. For every exposure, the laboratory parameters recorded were pressure, temperature and relative humidity (Knoll, 1999; Roberson and Carlson, 1992; Piesch, 1981). For all calculations involving the Cs-137 source, the kerma rate at that location was first determined in order to calculate exposure time. This was incorporated into the calculation for the time required to expose the TLDs for calibration. Initial exposures given for calibration were 1, 2 and 3 mSv to enable the plotting of a calibration curve. To determine the absorbed dose, the pressuretemperature correction factor was incorporated by using the expression: (5) where, Da is the absorbed dose, Dm is the measured value and PTCF is the pressure-temperature correction factor (Knoll, 1999): 2.50 2.00 1.50 1.00 0.50 0.00 0 0.5 1 1.5 2 2.5 3 3.5 Exposure(mSv) PTCF = (27315 . + T ) × 1013.25 (29315 . )× P Fig. 3: Calibration curve showing the TLD response to exposure at Hp(10) (6) The kerma correction is expressed as: P = pressure measured in kPa, T = temperature measured in degrees Celsius (IAEA, 2000a, b). Kair = Kref e K air is the kerma in air, Kref is the reference kerma, T1/2 is the half-life of the source, t is the days elapsed since last determined (IAEA, 2000a, b). This expression was corrected by the inverse square law in order to perform calculations regarding exposure times. − ln 2 t T1/ 2 (7) Data obtained from the initial TLDs indicated that the calibration curve showed a regular behaviour of LiF TLDs. The linearity of the curve indicated that the chips 877 Res. J. Appl. Sci. Eng. Technol., 3(9): 874-879, 2011 Table 5: Response of the TLDs to an exposure of 1mSv Reader's value [mSv] Et Card ID Exposure Es 085t 1.2524 025t 1.1268 577t 1 mSv 1.2809 485t 1.1788 379t 1.2654 504t 1.2228 271t 1.1013 086t 1.1218 055t 1.1498 305t 1.2568 % Deviation (Et - Es)/ Es 25.24 12.68 28.09 17.88 26.54 22.28 10.13 12.18 14.98 25.68 % Standard Dev. 3d2 5.41 6.01 5.29 5.75 5.35 5.54 6.15 6.04 5.89 5.39 Table 6: Response of the TLDs to an exposure of 2 mSv Reader's value [mSv] Et Card ID Exposure Es 504t 2.5027 271t 2.9657 086t 2 mSv 2.3407 055t 2.6043 305t 2.3592 423t 2.3003 080t 2.4038 076t 2.4305 077t 2.3366 379t 2.7030 % Deviation (Et - Es)/ Es 25.14 48.29 17.04 30.22 17.96 15.02 20.19 21.53 16.83 35.15 % Standard Dev. 3d2 8.37 7.06 8.95 8.04 8.87 9.10 8.71 8.61 8.96 7.75 Table 7: Response of the TLDs to an exposure of 3 mSv Reader's value [mSv] Et Card ID Exposure Es 423t 3.4137 080t 3.4499 76t 3.7254 077t 3.564 025t 3 mSv 3.3375 577t 3.0683 485t 3.3192 379t 3.3674 271t 3.2144 504t 3.8086 % Deviation (Et - Es)/ Es 13.79 15.00 24.18 18.80 11.25 2.28 10.64 12.25 7.15 26.95 % Standard Dev. 3d2 6.56 6.49 6.01 6.28 6.71 7.30 6.75 6.65 6.97 5.88 demonstrated linear response to the exposure. Different exposure values were given to the TLDs and then readout in the Harshaw 6600 TLD reader. Calibration data for the chips are shown in Table 4 Figure 2 and 3 are calibration curves for the various channels of the multi chip TLD card. In figure 3, the TLDs showed a linear dose response to the exposure at 1cm deep which is referred to as the Hp(10) or deep dose. During exposure, the time required for exposure was calculated based on the reference kerma on the day of exposure. It is corrected from a reference date, taking into consideration the time elapsed. Table 6 and 7 show the data generated from irradiating the chips to 2 and 3 mSv, respectively. After calibrating the TLDs, their responses showed that they were within ±20%, therefore acceptable for regulatory requirements. The percentage standard deviation ranged between 5.21 and 6.15%. These TLDs were then given various exposures whilst the set-up at the laboratory was still maintained. The panoramic source was left tangential to the wall. Table 5 shows the response of the chips. During the exposure, laboratory parameters were recorded as Pressure = 101.3 kPa (1013 mbar), Temperature = 26ºC, and Relative Humidity = 65%. The TLDs showed linear dose responses to radiations hence demonstrated a typical characteristic of LiF:Mg chips. While the batching showed a response range acceptable for radiation protection purposes, it was observed that the percentage differences were higher. The relative response values ranged from 0.91 to 1.52. The mean response of the chips ranged between 0.84 mSv and 1.33 mSv. These values yielded a mean response of 1.0187 mSv. The percentage response of the batched TLDs was 1.86% with the extreme individual ones being -38.97 and +48.4%. These chips were not classified as damaged because in subsequent exposures, their responses were reasonable. Background and leakage doses investigated showed no significant leakage that could contribute to the calibration setup because typical values ranged between 0.05 and 0.14 mSv/h at a distance of 0.6 m. This indicates that for usual regular calibration involving 1 to 5 mSv used in personnel monitoring calibrations, these background and leakage doses are 878 Res. J. Appl. Sci. Eng. Technol., 3(9): 874-879, 2011 minimal hence cannot have significant influence on the calibration value s as exposure times are not too long. ACKNOWLEDGMENT The authors would like to thank the management and staff of Ghana Atomic Energy Commission and the Radiation Protection Institute for making available their facilities to be used for the study. We are also grateful to the Radiation Physics team at University College London (UCL) for their technical support. TLDs exposed while the aluminium cylinder is tangential to the wall: Whilst the emphasis is on investigating secondary photons, the need to investigate effect of distance with respect to the wall is also necessary. When the TLDs were exposed, maintaining the usual set-up, the 1mSv exposure yielded +10.13% as the minimum and +28.09% being the maximum, with a maximum percentage standard deviation of 6.15%. The 2 mSv exposure yielded +15.02% as minimum while +48.29% being the maximum, with a maximum percentage standard deviation of 9.10%, 3 mSv exposure yielded +2.28 being the minimum and +26.95% as the maximum, with a maximum percentage standard deviation of 7.30%. REFERENCES Horowitz, Y.R., 1990. Study of the Annealing Characteristics of Li Mg, Ti using Computerised Glow Curve Deconvolution. Radiat. Prot. Dosim., 33: 255-258. IAEA, 2000a. Calibration of Radiation Protection monitoring Instruments. Safety Reports Series No. 16. IAEA, Vienna. IAEA, 2000b. Absorbed Dose Determination in External Beam Radiotherapy: An International Code of Practice for Dosimetry Based on Standards of Absorbed Dose to water Technical Reports Series. TRS-398, IAEA, Vienna, Austria. Knoll, G.F., 1999. Radiation Detection and Measurement, 2nd Edn., J. Wiley & Sons, Country, pp: 80-94. Radiation Protection Board, 2000. Occupational Radiation Protection. Radiation Protection and Safety Guide GRPB-G8, Country, pp: 16-17. Roberson, P.L. and R.D. Carlson, 1992. Determining the lower limit of detection for personnel dosimetry systems. Health Phys., 62(1): 2-9. Smith, F.A., 2000. A Primer in Applied Radiation Physics, World Scientific Publishing Co Ltd, Country, pp: 6-15, 257-259, 102-103. Piesch, E., 1981. Application of TLD Systems for Environmental Monitoring. In: Oberhofer, M. and A. Scharmann, (Eds.), Applied Thermoluminescence Dosimetry. Adam Hilgar, Bristol, pp: 197-228. CONCLUSION The results from the study indicate the presence of secondary photons (scatter) contributing to the exposures. The secondary photons could be generated from the backscatter from the walls of the laboratory, with the most contribution coming form the one tangential to the aluminium cylinder. While a contribution of 28.09% could be contributed to an exposure of 1 mSv and as much as 48.29% being added to an exposure of 2 mSv, the integrity of the calibration TLDs used for personnel monitoring may not be justified. The set-up may be used for calibrating dose monitors within the secondary standard laboratory context but may not provide proper calibration factors, and hence the need to collimate the beam Further work to be carried out by collimating the source would be recommended. This should focus on reducing or possibly eliminating the scatter. The work is still on-going and would investigate the case of displacement with respect to the wall tangential to the set up. Further work would be done to investigate the contribution of other secondary photons mentioned earlier by taking off the aluminium plate and cylindrical holder. 879
